U.S. Semiconductors, June 8th, 2026
How much would it cost to build a GW-level Vera Rubin data center?
Based on discussions with a range of industry experts, supply-chain research, and third-party data on off-cabinet costs—including land and physical infrastructure—we have updated our calculations of the economic viability of cabinet-level AI data centers built around the GB200/NVL72 and Vera Rubin NVL72 architectures.
We estimate that the Vera Rubin NVL72 is a cabinet priced at approximately $9.1 million. This estimate is significantly higher than the roughly $8 million reported in the media; we believe the latter figure is based on outdated memory prices. (For a detailed breakdown of the cabinet’s cost components, see Chart 1.) We constructed our own bottom-up estimate of the Vera Rubin NVL72 cabinet’s cost, arriving at $9.1 million. It’s worth noting that this figure is notably higher than the widely reported $8 million. We attribute this discrepancy primarily to memory prices: if we were to use the historical HBM4 price of around $16.6 per GB, we’d obtain a figure very close to the one we’ve calculated. However, we anticipate that by the time the Vera Rubin enters mass production in 2027, HBM4 prices will have risen to $53 per GB. Moreover, we believe NVIDIA is likely to employ some form of dynamic pricing mechanism, passing these increased costs on to customers rather than absorbing them themselves and putting pressure on profit margins. Consequently, we estimate that memory/storage costs will be closer to $3.2 million—significantly higher than the $2 million implied by historical prices. This underscores the fact that our own cost breakdowns can quickly become outdated, and investors relying on such estimates need to factor in memory price fluctuations frequently to keep their calculations accurate. That said, even with rising memory prices, the GPU (excluding HBM) remains the largest cost component, accounting for roughly $4 million. Beyond compute power and memory/storage, cost transparency remains relatively low. Nevertheless, we estimate that networking accounts for about $1.2 million of the remaining roughly $2 million, while cooling and power supply costs also represent a substantial portion.
Chart 1: NVIDIA Data Center GPU Cabinet Capital Expenditure Breakdown (by Architecture)
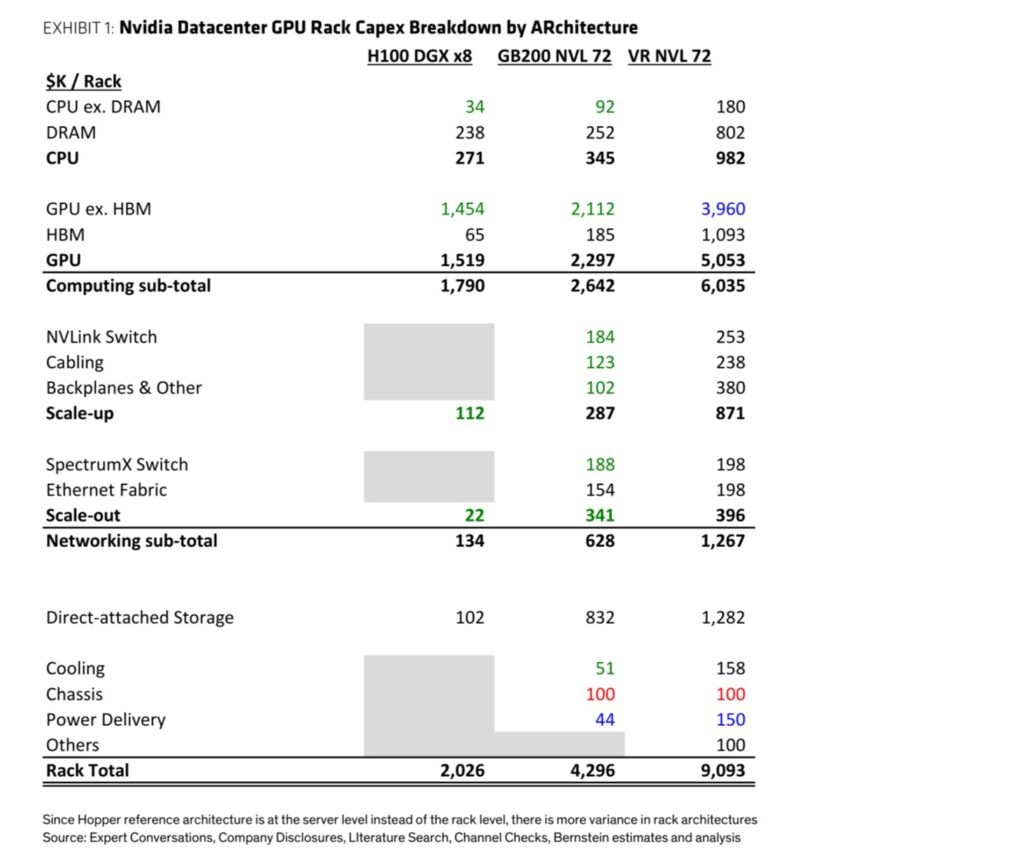
GPU/CPU. Our view aligns with widely reported estimates that the Rubin GPU sells for $55,000 per unit¹. Based on 72 GPUs per cabinet, the GPU costs alone amount to $3.96 million—nearly half of the total cabinet cost. Similarly, the Vera CPU is reportedly priced at $5,000 per unit; at 36 CPUs per cabinet, this translates to a total cost of $180,000.
Memory and storage. We expect memory and storage costs to reach $3.2 million per cabinet (representing approximately 35% of the cabinet’s total cost), significantly higher than the roughly $2 million implied by historical pricing. We believe this is the primary driver behind the discrepancy between our estimated cabinet cost of $9.1 million and the media-reported figure of about $8 million. This also serves as a further reminder that, given the ongoing volatility in DRAM and NAND prices, our own estimates could become outdated relatively quickly. Investors focused on this sector should frequently factor in fluctuations in DRAM and NAND prices to maintain accurate forecasts.
High-bandwidth memory (HBM). According to the specifications released by NVIDIA, HBM4 boasts a capacity of 20.7 TB (Chart 2). Currently, we model the price of HBM4 at $16.63 per GB². However, we anticipate that by the time Vera Rubin enters mass production in 2027, the price of HBM4 will rise to $48 per GB. Moreover, NVIDIA may adopt a dynamic pricing mechanism. As a result, NVIDIA should be able to pass this cost increase onto end customers rather than absorbing it itself, thereby avoiding pressure on profit margins. In fact, NVIDIA is likely to add an additional markup of around 10%, bringing the HBM price in the bill of materials paid by customers to approximately $53 per GB. Taking this price hike into account, the cost contribution of HBM rises from $344,000 to $1.1 million. We believe this represents the single largest driver behind the gap between our estimate and the widely reported cabinet costs of roughly $8 million.
Chart 2: NVIDIA’s announced specifications and Bernstein’s estimated specifications
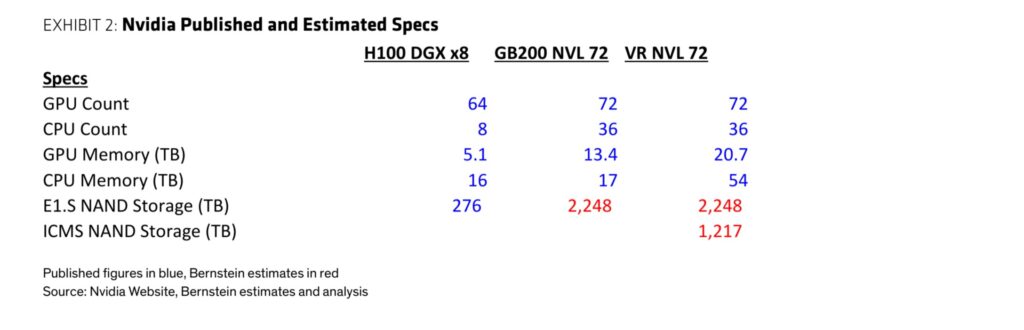
CPU DRAM. The VR specification includes 54 TB of LPDDR5X CPU memory. Although the contract price for mobile LP5X in Q2 2026 is $11.43 per GB, our channel surveys indicate that NVIDIA’s SOC AMM architecture carries a 30% premium over mobile DRAM prices. Therefore, we estimate the DRAM pricing at $14.85 per GB, resulting in a CPU DRAM value of $802,000 per cabinet. We also anticipate that LPDDR prices will continue to rise in H2 2026, but are likely to peak and begin declining sometime in 2027 or 2028. This introduces cost uncertainty for NVIDIA. A potential shortage of LPDDR could also limit shipments of VR and standalone Vera CPUs. Accordingly, NVIDIA might opt to default to installing lower DRAM capacities while allowing customers to upgrade independently after the VR or standalone Vera CPU ships, enabling customers to strike an optimal balance between their specific needs and the latest memory prices. Alternatively, NVIDIA could adopt dynamic pricing for VR and standalone Vera based on the most recent DRAM prices, thereby reflecting the ongoing uncertainty.
Remark ¹ Rubin consists of two GPU dies housed in a single package; however, nearly everyone in the industry—and even NVIDIA’s own specifications—count Rubin GPUs in terms of single packages.
Remark ² Strictly speaking, it’s $2.08 per gigabit multiplied by 8 bits per byte.
Direct-attached storage. Direct-attached storage has relatively lower transparency, as the storage is excluded from NVIDIA’s specifications and its configuration is likely to vary. However, for the GB200NVL72, we are working with Supermicro… The data sheet (link) for the Micro serves as the anchor; this table shows that each of the 18 compute trays is equipped with 8 E1.S hard drives, totaling 144 slots. Assuming each slot has a capacity of 15.36 TB (consistent with the Solidigm D7-PS1010), and each tray also includes a 2-TB M.2 boot drive, the total NAND capacity of Blackwell amounts to 2.2 PB. For Vera Rubin, we assume the E1.S capacity remains unchanged and add an additional 16.9 GB of ICMS capacity per GPU, resulting in a total NAND capacity of 3.5 PB. Assuming the price of TLC NAND is $0.37 per GB (a 30% premium over current consumer-grade prices—consistent with the premium paid for DRAM), we calculate the storage value at $1.3 million per cabinet.
What about HDDs? Our analysis focuses on server cabinets, so we’re particularly interested in server-direct attached storage. Given the sharp rise in NAND prices, direct-attached storage now accounts for a much larger share of costs than it did in our analysis last year—back then, NAND was 75% cheaper and had significantly lower capacities. Moreover, the availability of NAND is becoming increasingly worrisome (though AI buyers are willing to pay a premium and secure priority access amid limited supply, thereby easing some of this concern). However, data center operators seem reluctant to replace NAND with HDDs in direct-attached storage, as declining performance remains a lingering concern—especially when DRAM and HBM are also in short supply, making the use of lower-performance storage even more burdensome on memory resources. Additionally, since HDDs are bulkier and consume more power than NAND, integrating HDDs into server cabinets (rather than using external storage arrays) would likely require extensive redesigns, which might prove challenging for some second-tier CSPs. That said, in cold-storage scenarios that are less sensitive to latency—for instance, the backend stages of SSN attention networks—storage typically resides in external storage arrays, and this segment actually accounts for the lion’s share of total storage capacity. In external storage environments, we’ve already observed higher adoption rates of HDDs, consistent with the industry average of “20% NAND and 80% HDD by GB capacity.” For an introductory overview of the HDD industry, please see: “Global Hard Disk Drives: The Era of HAMR Has Arrived! An Introduction to the HDD Industry—and Why Seagate (STX) Is Poised for Outperformance.”
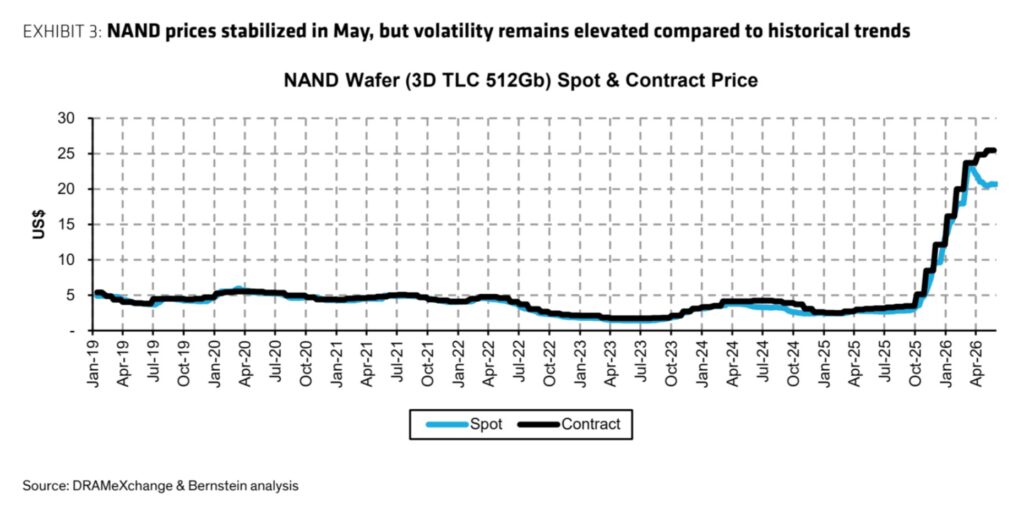
Memory and storage prices continue to experience sharp fluctuations; investors (and industry participants!) need to closely monitor price movements. Although it may seem somewhat redundant to point this out—despite NAND prices stabilizing month-on-month in May, overall memory price volatility remains significantly higher than historical levels. Since hitting their low in April 2023, NAND prices have surged by a factor of 11.3 through May 2026 (with an annualized compound growth rate of 115%), a stark contrast to the -20% annualized compound growth rate observed from January 2019 to April 2023 (Chart 3). Moreover, we believe NVIDIA likely employs dynamic pricing mechanisms to protect its profit margins, meaning that price fluctuations are increasingly being passed on to end customers. Consequently, investors—and industry participants!—relying on this analysis must frequently factor memory/storage price volatility into their calculations to maintain accuracy. Our latest forecasts for DRAM and NAND prices can be found in our monthly memory price tracking report: “Memory Tracking (May): Q2 CY26 Prices Up Approximately 60% QoQ, but Price Growth Pace in H2 CY26 May Slow Down.”
Chart 3: NAND prices stabilized in May, but volatility remains higher than historical trends
Networking. The differences in network architecture (and costs) can be even more significant—particularly when third-party scale-out switches replace SpectrumX top-of-rack switches. This appears to be one of the more common practices among hyperscale customers as they deviate from NVIDIA’s reference architecture. However, based on our discussions with industry participants, we believe that network costs accounting for roughly 13% of cabinet costs is quite typical. The cost breakdown by type is as follows: scale-up accounts for 8%, and scale-out accounts for 5%. Specifically, we estimate that the NVLink switch costs approximately US$250,000 (9 switch trays, each containing 2 NVSwitch chips, for a total of 18 chips); cabling costs about US$240,000; and backplanes and other scale-up components account for roughly US$380,000. Similarly, we estimate the SpectrumX switch to cost around US$200,000, which we believe represents about half of the total cost of the scale-out fabric.
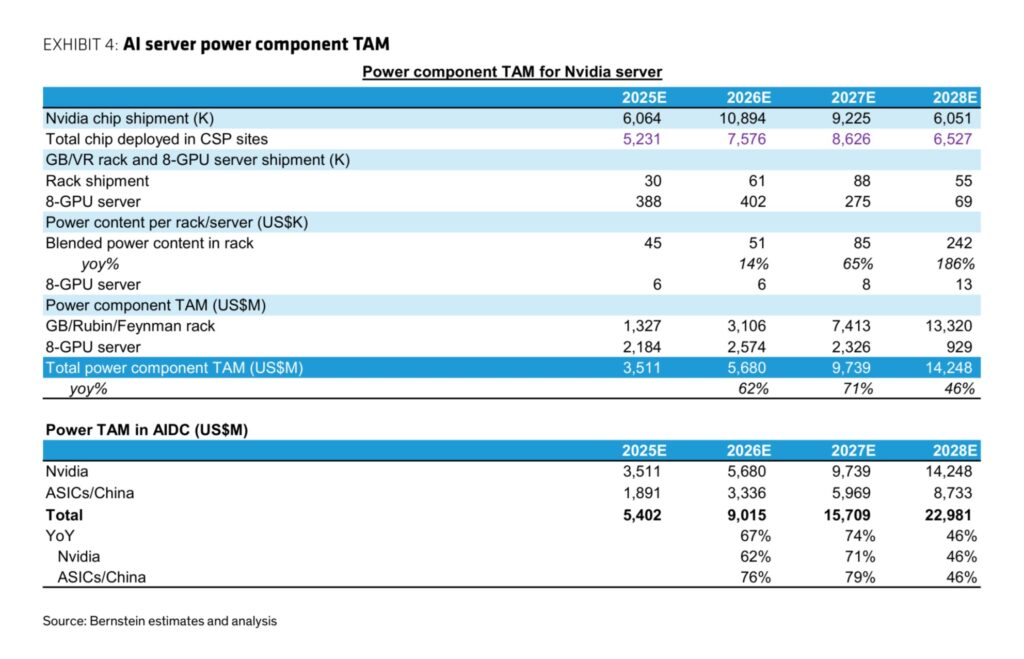
Cooling and power supply. We estimate that the value of power supplies will rise from approximately USD 50,000 per cabinet under GB200 to about USD 150,000 under VR (Chart 4—see “Delta Electronics Q1 2026: Expanding Production to Meet Long-Term AI Demand; Target Price Raised to NT$2,620” for more details). Based on our discussions with industry experts, we estimate that cooling costs will amount to roughly USD 160,000 (representing 2% of the total cabinet cost).
Chart 4: AI server power component TAM
Other. For the smaller components in the BOM, our level of confidence is lower, as these components are more likely to be omitted from the specifications and are harder to estimate from top to bottom. It’s worth noting that although multilayer ceramic capacitors (MLCCs) have become a hot topic of discussion, we’re still unable to form a high-confidence assessment. However, based on industry discussions, our best estimate is that the chassis cost approximately US$100,000, with another roughly US$100,000 for other cabinet contents, bringing the total BOM cost to around US$9.1 million.
Given that the Vera Rubin NVL72 cabinet has a rated power of 220 kW, and considering that cabinets account for approximately 80% of the total power consumption in a data center, we estimate about 3,557 cabinets per GW. This translates to a cabinet cost of roughly USD 32 billion per GW. Adding to this the physical infrastructure costs of approximately USD 15 billion per GW, the total capital expenditure for a full-scale AI data center comes to around USD 47 billion per GW—see Chart 5.
Chart 5: Data Center Infrastructure Capex Breakdown
Chart 6: Rack Level Price Performance
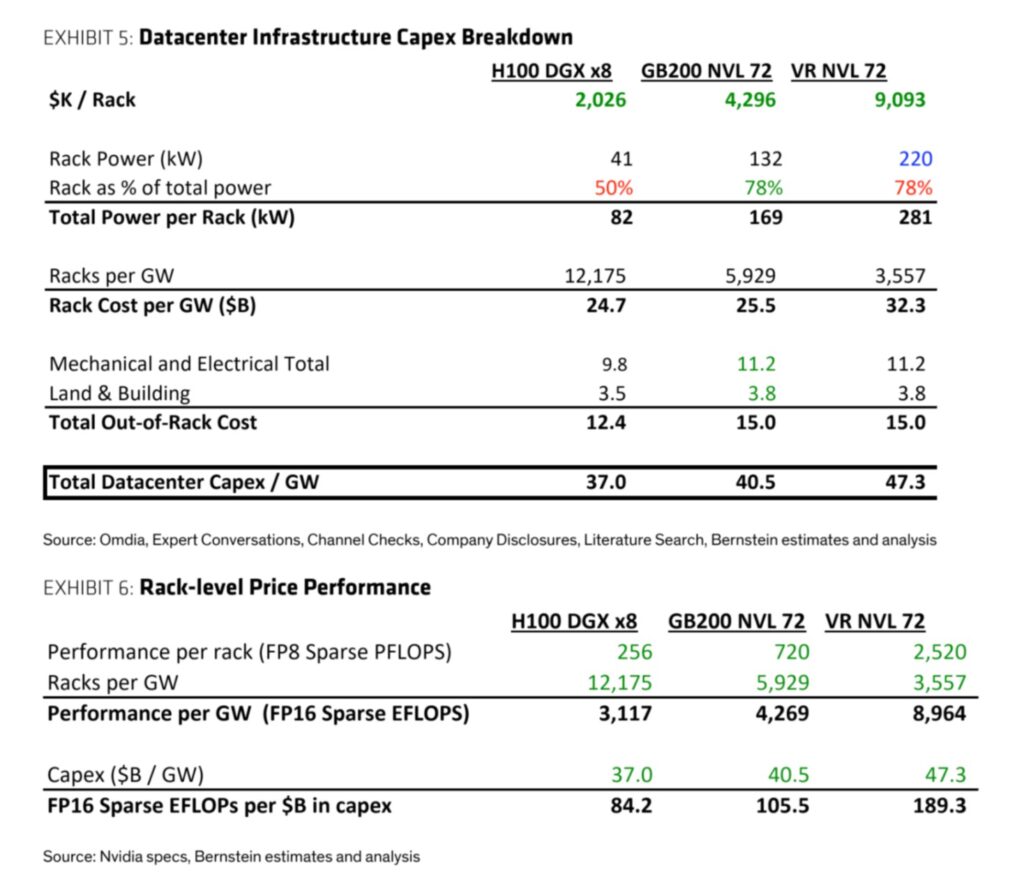
The cost of approximately $91 million per cabinet translates into a cabinet cost of roughly $32 billion per GW. We observed that, excluding redundancy, the VR cabinet design has a power rating of 220 kW per cabinet, higher than the 130 kW specified in GB200. We maintain our previous estimate for GB200—that cabinets account for 78% of the data center’s power load3—implying that each cabinet corresponds to a total data center power consumption of 281 kW. Consequently, a GW-scale data center can support 3,557 cabinets. This, in turn, means that the cabinet cost per GW amounts to $32.3 billion.
Total capital expenditure per GW: $47 billion. Based on our discussions with data center operators, for new construction projects of top-tier facilities, we’ve observed that the cost of physical infrastructure per GW ranges from $12 to $15 billion. Using the previously established figure of $15 billion per GW for Blackwell, we estimate the total capital expenditure for AI data centers at $47 billion per GW.
It’s worth noting that this appears to reflect a sustained acceleration in FP8 performance per dollar. According to NVIDIA’s published specifications, the Vera Rubin NVL72 cabinet achieves a performance of 2,520 PFLOPS, significantly higher than Blackwell’s 720 PFLOPS. This means that computing power is accelerating markedly along two key dimensions: performance per gigawatt and performance per dollar (Chart 6). That said, our overall view is that, in an environment where computing power is highly constrained, it still makes sense to keep running GPUs for as long as possible—even if older GPUs offer poorer cost-effectiveness compared to newer models. Consequently, data center operators will likely prioritize using newly built data centers primarily for deploying the latest-generation GPUs. However, if data center operators face constraints—such as power limitations or physical infrastructure challenges—that prevent them from building capacity to accommodate the newest chips, they may need to seriously consider retiring their older GPUs to make room for the new ones.
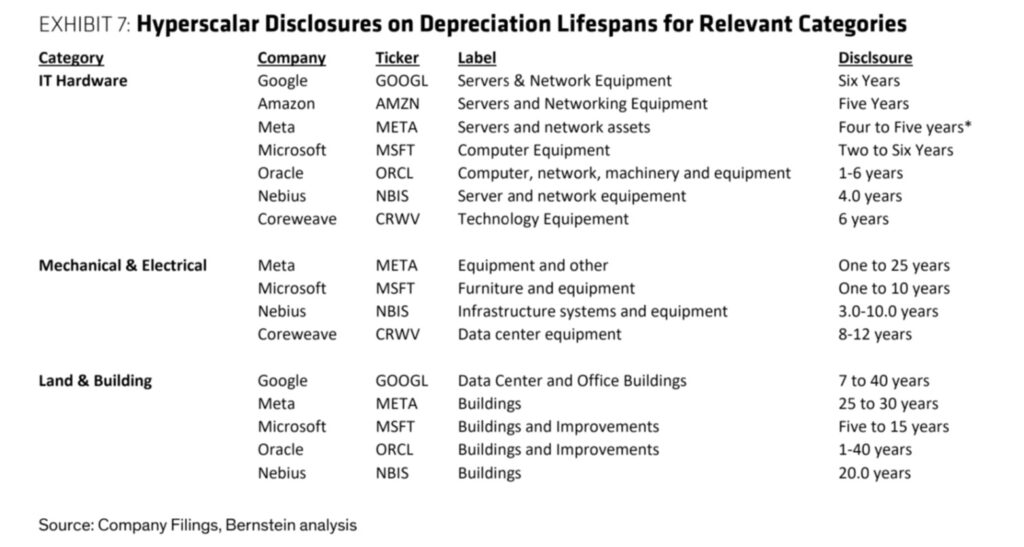
Given that the depreciation periods for IT hardware such as servers and networks are shorter than those for electromechanical equipment or land and buildings, and given their relatively lower operating costs, the true economic cost may be even more heavily skewed toward servers and networks than implied by cash capital expenditures. Even under a relatively high electricity price of $0.15 per kWh, the annual electricity cost of operating a GW-scale data center would amount to roughly $1.3 billion. Labor costs can also be considered negligible—according to reports, even the largest data centers are operated by just 8 to 10 people, at an annual cost of $30,000 to $80,000 per person. By comparison, even with a depreciation period of 6 years, the annual depreciation expense corresponding to capital expenditures would still be around $7.9 billion. Given the relatively high proportion of capital expenditures compared to ongoing operating costs, and the fact that the depreciation period for hardware is shorter than that for physical infrastructure (Chart 7), the true TCO (total cost of ownership) economics may in reality be even more heavily weighted toward servers, storage, and networking than implied by cash outlays alone.
Chart 7: Hyperscalar Disclosures on Depreciation Lifespans for Relevant Categories
The increase in the value of DRAM and power supplies is particularly striking; we also believe that the value of backplanes is on the rise. Based on generational transitions, we’ve observed that the growth in power supply value significantly outpaces the growth in overall cabinet value. The share of power supply value relative to the total cabinet value has risen from 1.0% to 1.6%, driven by higher power loads and the early-stage adoption of 800VDC (see Chart 4 again for details). We continue to view Delta Electronics as one of the primary beneficiaries of the rising value of power supplies, even as Vertiv is stepping up its efforts to capture a larger share of this market. Similarly, CPU DRAM specifications have grown by 320% when measured in TB—this represents a dramatic increase in value, even without factoring in the recent DRAM price hikes. Notably, this growth far exceeds the approximately 50% capacity growth seen in NAND and HBM. We’ve also received some feedback indicating that the use of CXL memory for KV caching is on the rise, which could further boost the value of DRAM. Although this still appears to be in the exploratory phase and we’re not yet able to quantify its potential impact, it further supports the view that, “if supply permits, DRAM could benefit disproportionately.” While the value of PCBs/backplanes is harder to quantify (as they seem to lie upstream of several different components), we continue to expect their value to grow—especially for ABF backplanes—and remain optimistic about Ibiden and Unimicron (for more details, see: “ABF Backplanes: CPU Revival Fuels ABF Shortage; Raising Ibiden’s Target Price to JPY23,900”).
Available computing power continues to accelerate. By 2026, application penetration among end users appears to have picked up pace, driving robust growth in AI labs. Anthropic reported that its annualized revenue (run-rate revenue) surged from $9 billion at the end of 2025 to $47 billion by May. This growth has been achieved despite constraints on computing power—constraints that have compelled the company to forgo certain customers and revenue rather than overextend itself in terms of computing capacity. As the Rubin cycle further boosts available computing power, we believe this will unlock even greater potential for the widespread adoption of AI applications.
Remark ³ Based on the assumption that PUE is 1.15 and server cabinets account for 90% of the total power of IT equipment.
FOR REFERENCE
Chart 8: Consensus expects that the total capex of ultra-large-scale vendors will increase by 69% year-on-year in 2026 and rise another 13% in 2027
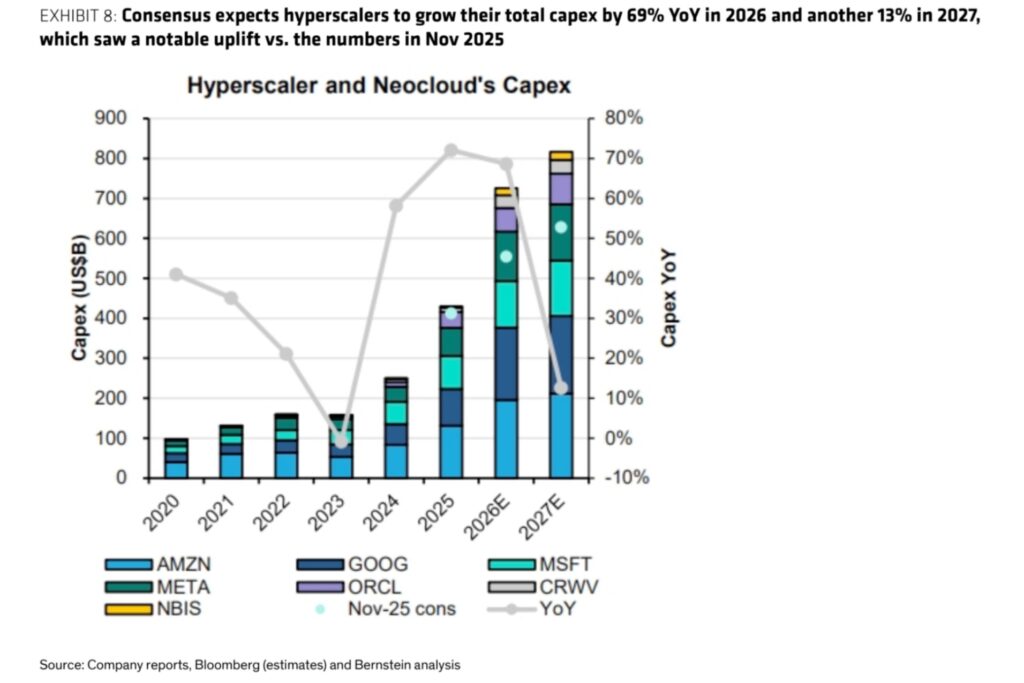
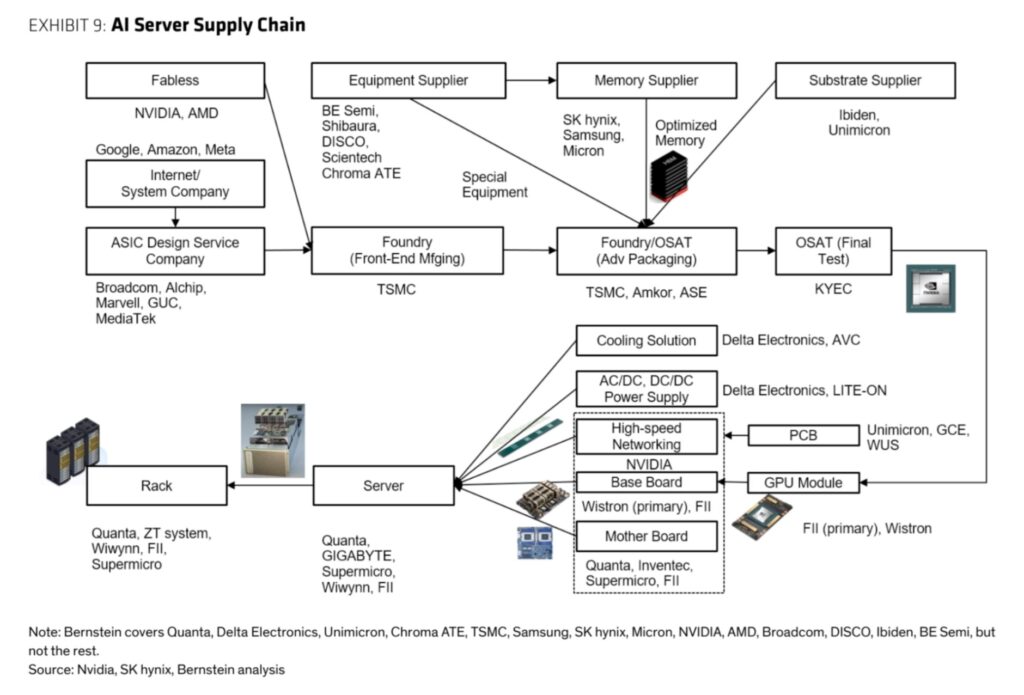
Chart 9: AI Server Supply Chain