
Plugin Capital Research : 30 September 2026
Primary sources first: SEC 10-Q / 10-K / 6-K filings, company investor-relations releases, official pricing pages. Secondary sources are flagged as not primary or to be verified.
Fiscal-year note: CoreWeave and Nebius report on calendar quarters; IREN, Hut 8 and Applied Digital use June-end or straddling fiscal years. Each figure is flagged individually and never mechanically blended.
Seven conclusions up front
These seven findings carry the most weight in this report. Each is sourced in the body and flagged with the calibre of the underlying figure.
- The sector has crossed from concept to structural infrastructure. On Synergy Research’s definition, Neocloud revenue reached roughly USD 25bn in 2025, with USD 9bn booked in Q4 alone (up 223% year on year), and is forecast to compound at 58% to about USD 400bn by 2031. In Q2 2026, nine Neoclouds ranked among the world’s 40 largest cloud providers.
- Only two operators are both audited and genuinely scaled. CoreWeave and Nebius are the only companies disclosing quarterly financials under SEC rules. The other eighteen are either private (rich multiples, no audited accounts), landlords (revenue recognised long after contracts are signed), or platforms (no owned compute).
- The real dividing line is not GPU count but the trio of power contracts, financing cost and customer credit. The leading tier on contracted power: Nebius at 5.0GW (target), IREN with a 5GW+ pipeline, Crusoe at 4.9GW and CoreWeave at 4.2GW. Whoever locks cheap power and investment-grade debt first sets prices in the next cycle.
- Pricing sits in three clear tiers. Bare-metal and spot at USD 1.7-3.9 per GPU-hour (Vast.ai, Vultr, Lambda, Nebius, Crusoe); brand and reliability at USD 6-8.6 (CoreWeave, RunPod, Hyperstack, Baseten); software and orchestration premium at USD 8-20 (Fireworks AI, Together AI, Baseten). Against the USD 6-12 range for an H100 SXM5 at a hyperscaler, the Neocloud median discount is roughly 30-60%.
- Customer concentration is the industry’s largest hidden risk. CoreWeave’s USD 104bn backlog leans heavily on Meta, OpenAI and Anthropic; Meta plus Microsoft account for roughly 94-95% of Nebius’s disclosed backlog; Microsoft and Anthropic are 85% of Nscale’s contracted value; about 77% of Core Scientific revenue comes from CoreWeave alone.
- The most under-appreciated mismatch is contract tenor versus asset life. Leases run 15-20 years while GPUs are generally depreciated over 4-6. The revenue-recognition curve for landlords (Applied Digital holds USD 36.2bn of contract value but will recognise only USD 451m in FY27) lags the valuation the market assigns on contract value.
- Contrarian evidence is worth recording. NVIDIA simultaneously acts as shareholder, supplier and part-customer — a circular-financing structure questioned publicly by US senators and by Michael Burry (short Nebius) and Jim Chanos (sceptical on IREN). That does not prove a bubble, but it does mean safety margins are materially thinner when these companies are priced on contracted value rather than cash flow.
01 Scope, definition boundaries and selection criteria
1.1 What counts as a Neocloud (the definition used here)
A Neocloud is a cloud provider whose core product is GPU-accelerated compute, engineered from the architecture up for AI and HPC workloads — bare metal, InfiniBand/RDMA, liquid cooling and very high rack density. It differs from a hyperscaler that simply adds GPU SKUs onto a general-purpose virtualised estate. Four structural differences define the category:
| Dimension | Hyperscaler (AWS / Azure / GCP) | Neocloud |
| Architecture | GPUs layered onto an existing CPU-centric virtualised estate | GPU-first design, bare metal with no virtualisation overhead |
| Networking | Predominantly Ethernet | InfiniBand plus RDMA (GPUDirect); no bottleneck at large cluster scale |
| Pricing | H100 SXM5 at roughly USD 6-12/GPU-hr, plus egress and storage charges | From about USD 2-3/GPU-hr; most include or sharply reduce egress fees |
| Supply speed | Squeezed by competing internal business lines; allocation is tight | The whole organisation exists to deliver GPUs; faster energisation |
Source: Synergy Research Group, April 2026 Neocloud thematic report; THE ELEC reproduction (not primary). Price ranges are industry ranges, not a single vendor’s list price.
1.2 Boundary calls: three categories that are nominally ‘Neoclouds’
One key development in 2026 is that the word ‘Neocloud’ has been stretched. To avoid conflating fundamentally different businesses, this report assigns an explicit tier to every company and labels its true business character in each entry:
- Included, labelled ‘landlord’: IREN, Hut 8, Galaxy Digital, Applied Digital, Core Scientific, Cipher Digital and TeraWulf. These supply powered shell or colocation and the tenant brings its own GPUs. Their revenue is rent, not compute service fees — a completely different margin structure and risk exposure from an owner-operated GPU cloud.
- Included, labelled ‘platform’: Together AI, Fireworks AI, Baseten and Modal. They own no data centres, earning service fees from multi-cloud scheduling and inference-optimisation software. They are customers and suppliers of the heavy-asset players rather than pure competitors.
- Excluded: (i) pure crypto miners with no material AI revenue; (ii) entities that have lost independent standing — Northern Data / Taiga Cloud (acquired by Rumble Inc. for about 85.2% in an all-stock deal completed 17 June 2026, renamed RUM Group, folded into the Quake AI division and delisted), Genesis Cloud (acquired by Volta Infra on 11 June 2026, team and stack absorbed) and Ori Industries (merged with Brookfield’s Radiant platform in February 2026); and (iii) OpenAI, Anthropic and Oracle — although Synergy ranks them among high-growth tier-2 cloud providers, they are model companies or hyperscalers, not Neoclouds.
| One widely repeated claim that needs correcting It is commonly said that Northern Data sold its bitcoin mining business to Riot Platforms. No credible source supports this. The actual buyers were three companies linked to Tether executives (Highland Group Mining, Appalachian Energy and 2750418 Alberta ULC) for consideration of up to USD 200m, completed on 3 November 2025. Riot Platforms’ roughly 2.5GW power reserve refers to an entirely different company and must not be conflated. |
1.3 Selection criteria (quantified, five weighted factors)
| 40% | 2026 AI-cloud / compute-lease revenue scale and growth Highest weight: revenue is the only metric that cannot be talked up |
| 25% | Contracted plus live / energised power Sets the revenue ceiling for the next 24 months |
| 15% | Signed contract value (backlog) Must distinguish total contract value from recognised revenue |
| 12% | Financing capability and capital structure Access to investment-grade debt is a core competitive asset here |
| 8% | Customer mix and third-party quality ratings SemiAnalysis ClusterMAX 2.0 and comparable benchmarks |
1.4 The Top 20 (ranked by composite score)
| # | Company | Listing / ticker | Business character | Positioning in one line |
| 1 | CoreWeave | NASDAQ: CRWV | Owner-operated GPU cloud | The only player combining scale, investment-grade debt and the top third-party rating |
| 2 | Nebius Group | NASDAQ: NBIS | Owner-operated full-stack AI cloud | Fastest grower, best-capitalised challenger, only published B300 on-demand rate |
| 3 | Crusoe | Private | Energy-integrated | Turns power procurement itself into the product; the only AMD full-stack option |
| 4 | FluidStack | Private | Asset-light delivery | Holds Anthropic’s USD 50bn deal; a specialist in matching and fast energisation |
| 5 | Lambda | IPO targeted H2 2026 | Developer GPU cloud | Lowest published B200 rate and the friendliest self-service, at roughly one tenth of CoreWeave’s scale |
| 6 | Nscale (UK) | S-1 filed | Self-built sovereign AI factory | USD 103.4bn signed but only USD 2.6bn live; the S-1 carries going-concern language |
| 7 | IREN | NASDAQ: IREN | Vertically integrated | Australian-origin, expanding on three fronts; AI cloud revenue up eightfold |
| 8 | Firmus (AU/SG) | ASX listing 22 Oct 2026 | Liquid-cooled modular AI factory | Australia’s second-largest IPO on record (A$7bn); two Malaysian sites supplying OpenAI |
| 9 | Hut 8 | NASDAQ: HUT | Power-first landlord | First single-sponsor investment-grade construction-period data centre debt; standardised on NVIDIA’s DSX reference design |
| 10 | Galaxy Digital | NASDAQ: GLXY | Landlord colocation | Helios campus permitted for 1.63GW in a single site; CoreWeave sole tenant at over USD 1bn a year |
| 11 | Applied Digital | NASDAQ: APLD | AI Factory landlord | USD 36.2bn of contract value but a very late revenue curve; perpetual preferred ranks ahead of common |
| 12 | Together AI | Private | Inference platform plus GPU | Hosts 200+ open models; moving from subleasing to 250MW of self-built capacity |
| 13 | Fireworks AI | Private | Inference platform | Over USD 1bn annualised revenue and 40 trillion tokens a day; USD 17.5bn is the richest platform valuation |
| 14 | TeraWulf | NASDAQ: WULF | Hybrid (landlord plus owned compute) | Anthropic’s 20-year 401MW / USD 19bn lease, yet adjusted EBITDA is still negative |
| 15 | Core Scientific | NASDAQ: CORZ | Pure colocation landlord | Independent after CoreWeave’s takeover was voted down; subsequently signed AMD for 15 years and 530MW |
| 16 | Cipher Digital | NASDAQ: CIFR | Landlord | Dual long-term leases with AWS and FluidStack; its ERCOT Batch Zero queue position is the core asset |
| 17 | Baseten | Private | Inference platform | Schedules across 18 clouds and 87 clusters; cold starts under 10 seconds; valued at about 22x ARR |
| 18 | Modal | Private | Serverless platform | Sandboxes are now more than a third of revenue; a deliberate bet on RL training infrastructure |
| 19 | Core42 (G42, UAE) | Private | Sovereign AI cloud | The only Gulf provider licensed to acquire advanced NVIDIA silicon at scale under US export controls |
| 20 | Yotta Data Services (India) | IPO planned | Sovereign GPU cloud | Over 20,000 Blackwell Ultra online; about USD 12bn of expansion announced for 80,000 Vera Rubin chips |
Watchlist (ranks 21-30: insufficient scale or disclosure, but worth tracking)
| Company | Key data | Why it matters |
| Vultr (Constant) | 33 regions across 6 continents; USD 3.5bn valuation (Dec 2024); H100 from about USD 2.30/GPU-hr | The broadest geographic footprint among mid-tier alt-clouds; dual NVIDIA and AMD silicon |
| RunPod | About USD 240m ARR (June 2026); USD 100m Series A at USD 1bn; turned down an acquisition offer above USD 500m | One of the fastest-growing developer-layer providers; FlashBoot cold start under 200ms |
| Groq | USD 350m at USD 3.5bn in Aug 2026, half its Sept 2025 valuation; 54MW going to over 200MW by 2027 | Licensed LPU technology non-exclusively to NVIDIA in Dec 2025 (reported around USD 20bn); its own silicon roadmap ended |
| Bitdeer (BTDR) | AI cloud revenue USD 14.0m per quarter; AI cloud ARR about USD 76m; power cost USD 44/MWh | A 16-year, USD 4.7bn lease to Volta (an NVIDIA Cloud Partner); the Singapore-headquartered Asian reference case |
| E2E Networks (NSE: E2E) | FY26 revenue INR 2,456m (+49.8%); Q1 FY27 up 334% year on year with a 75.2% EBITDA margin | India’s only listed pure GPU cloud, and the clearest path to profitability (PBT already positive) |
| Scaleway (Iliad) | About 5,000 GPUs; H100 at USD 3.27 and B300 nodes at USD 8.55 per GPU | Europe’s most complete data-sovereignty narrative; parent Iliad generated EUR 10.35bn of revenue in 2025 |
| SF Compute | USD 40m Series A at about USD 300m; H100 self-service around USD 1.82/hr | The only player running a compute order book with resale — a capacity-market model |
| Vast.ai | 20,000+ GPUs, 1,000+ independent hosts, 68+ models; H100 from USD 1.73 | Sets the market’s price floor; the observation point for sector-wide price deflation |
| WhiteFiber (WYFI) | FY25 revenue USD 79.2m; 40MW / 10-year lease to Nscale worth about USD 865m | Both a landlord and a supplier to Nscale; a test case for the landlord-to-cloud upgrade path |
| Volta Infra | USD 300m seed plus Series A at USD 2.4bn; 133MW at Tydal, Norway; a USD 10bn / 6-year contract with an unnamed AI lab | Signed a USD 10bn contract seven months after founding — the most aggressively levered case in this cycle |
02 Market size and competitive landscape
Market-size estimates diverged sharply in 2026, and the root cause is definitional: Synergy counts GPU-only cloud service revenue, while Mordor and Dimension use broader definitions that include supporting infrastructure and services. Both are presented side by side here rather than choosing one.
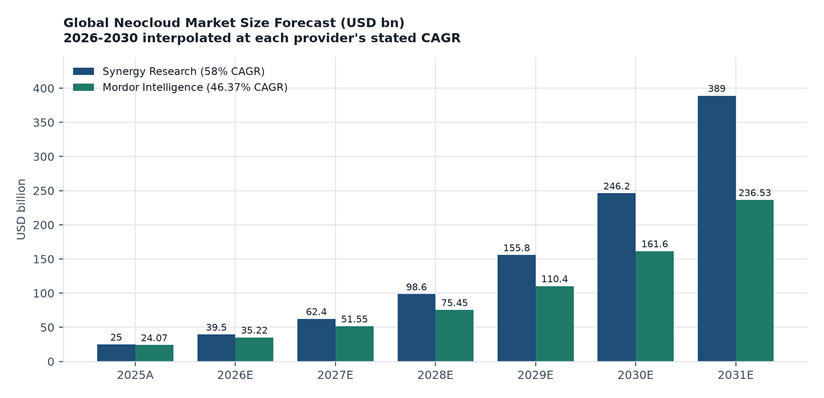
Figure: Global Neocloud market size forecast (USD bn)
Sources: Synergy Research Group, April 2026 Neocloud thematic report (reproduced by THE ELEC, 2026, not primary); Mordor Intelligence, January 2026 report. For reference, Dimension Market Research sizes the market at USD 40.5bn in 2026 rising to USD 2,769.3bn by 2035 (59.9% CAGR, North America at 43.1% share), and ABI Research puts the addressable GPU-as-a-Service opportunity at USD 250bn by 2030. Calibres differ materially; treat these as orders of magnitude only.
| Year | Synergy (USD bn) | Mordor (USD bn) | Calibre note |
| 2025 (actual) | 25.0 | 24.07 | Synergy: USD 9bn in Q4 alone, up 223% year on year. Mordor is full-year 2025 |
| 2026E | 39.5 | 35.22 | Synergy interpolated at 58% CAGR; Mordor is the official forecast |
| 2027E | 62.4 | 51.55 | Interpolated at each provider’s CAGR |
| 2028E | 98.6 | 75.45 | Interpolated at each provider’s CAGR |
| 2029E | 155.8 | 110.4 | Interpolated at each provider’s CAGR |
| 2030E | 246.2 | 161.6 | Interpolated at each provider’s CAGR |
| 2031E | 389.0 | 236.53 | Synergy about USD 400bn (58% CAGR); Mordor USD 236.53bn (46.37% CAGR) — both official forecasts |
2.1 Three numbers that must be read together
| USD 143.4bn | Q2 2026 global cloud infrastructure spend Up 43% year on year — the fastest in eight years and the eleventh consecutive quarter of acceleration (Synergy, 30 Jul 2026) |
| +165% | GenAI-specific cloud services growth Far ahead of the 43% for the cloud market overall (Synergy, 30 Jul 2026) |
| 9 of 40 | Neoclouds among the world’s 40 largest cloud providers It was five in the top 30 at Q1 2026; Neoclouds are about 5% of the total cloud market |
Source: Synergy Research Group Q1/Q2 2026 cloud market reports, reproduced by Chinese financial media on 31 July 2026 and TMC Insight in August 2026 (not primary). Synergy names the fastest-growing tier-2 providers as CoreWeave, OpenAI, Oracle, Crusoe, Nebius, Anthropic and Nscale — among which Crusoe and Nscale are the cleanest pure-Neocloud over-performers.
| A geographic signal that is easy to miss Synergy specifically identifies India, Indonesia, Ireland, Thailand and Malaysia as the fastest-growing national cloud markets in local-currency terms, all well above the global average. This is directly relevant to the reader’s vantage point: Southeast Asia is not only the fastest-growing demand region, it is where Neocloud supply is now being offshore-deployed. Firmus has two Malaysian sites supplying OpenAI, and Bitdeer has deployed GB300 NVL72 in Cyberjaya and Johor Bahru. Regional modular and rapid-deployment capability is a stronger comparative advantage than competing for existing power in the US or Europe. |
03 Four operating models
Splitting the 20 by three questions — who supplies the capital, who carries the GPU risk, and how revenue is recognised — shows clearly that they are four quite different businesses.
| Model A · Owner-operated compute cloud | CoreWeave, Nebius, Lambda, Nscale, IREN, Core42, Yotta Owns or long-leases data centres, buys GPUs and runs the platform, charging per GPU-hour or per token. • Capital intensity: highest (capex can run 3-5x revenue) • Gross margin: 60-80% target (pre-depreciation) • Risk: carries both GPU depreciation and financing cost • Pricing power: strong (premium on new-generation silicon) |
| Model B · Energy-integrated | Crusoe, FluidStack (asset-light variant) Makes power procurement and fast energisation the core product: holds its own power sources, builds the DC, delivers customised gigawatt-scale capacity to AI labs. • Core moat: power, interconnection speed, land — not GPUs • Monetisation: long-term compute leases plus owned cloud revenue • Risk: energy permitting, grid queues, single-customer dependence • Pricing power: medium (cost-led, driven by power spreads) |
| Model C · Landlord (colocation) | IREN, Hut 8, Galaxy, Applied Digital, Core Scientific, Cipher, TeraWulf Supplies powered shell; the tenant brings its own GPUs under 10-20 year triple-net, take-or-pay leases. • Advantage: no GPU depreciation risk; behaves like a REIT • Disadvantage: low revenue per MW (about USD 1.8-2.2m per IT MW per year) • Key risk: very late revenue recognition, concentrated tenants • Leverage: project-level debt of 68%+ is common |
| Model D · Inference / serverless platform | Together AI, Fireworks AI, Baseten, Modal Owns no data centre; charges per token or per second for cross-cloud scheduling, inference kernels and orchestration software. • Capital intensity: lowest, yet the fastest growth (Modal 5x in eight months) • Gross margin: about 50% (compressed by cloud costs) • Valuation: 22x ARR (Baseten) — well above the heavy-asset players • Risk: the moat may be illusory — squeezed from both sides by clouds and model owners |
| Model choice is really a choice about whose balance sheet carries the risk Model A keeps GPU obsolescence risk in-house. Model C transfers it to tenants in exchange for a very long revenue tail and thin margins. Model B bets on the long-run scarcity of power assets. Model D takes on no capital at all and bets on software being irreplaceable. The most counter-intuitive fact of 2026 is that the richest valuation multiples sit with the asset-light Model D (Baseten about 22x ARR, Modal about 15x), while adjusted EBITDA at most Model C companies is still negative. That in itself deserves scrutiny. |
04 The Top 20 at a glance
The table below is the unified quick-reference matrix. All amounts are USD; the calibre of the ‘AI cloud / compute revenue’ column is stated in brackets, and figures on different calibres must not be added or subtracted.
| # | Company | Latest revenue / annualised (calibre) | Contracted power | Live / energised power | Valuation / market cap (as of) | Key customers | Model |
| 1 | CoreWeave | Q2’26 revenue USD 2,575m (+112% YoY); FY26 guidance USD 12.4-13.2bn | 4.2 GW | 1.5 GW / 51 DCs | About USD 48.3bn (25 Sep 2026) | Meta, OpenAI, Anthropic, Microsoft, Jane Street | A |
| 2 | Nebius | Q2’26 revenue USD 582.3m (+454%); AI cloud ARR USD 3.0bn | 5.0 GW (target) | 0.8-1.0 GW (target) | About USD 60.9bn (19 Aug 2026) | Meta USD 27bn; Microsoft USD 17.4-19.4bn | A |
| 3 | Crusoe | 2026E about USD 2bn (company guidance; about USD 500m in 2025) | 4.9 GW | About 0.2 GW | USD 30.9bn (17 Sep 2026, Series F) | Oracle/OpenAI, Microsoft, Meta, Google, Jane Street | B |
| 4 | FluidStack | 2026E about USD 660m (media/institutional memo to verify) | 1.3 GW (2026 plan) | Not disclosed | USD 18bn+ (3 Sep 2026) | Anthropic USD 50bn; Google TPU; Meta | B |
| 5 | Lambda | 2026E over USD 1.5bn (media to verify) | 3 GW by 2030 (target) | About 15 US DCs | In talks for USD 3bn at over USD 12bn (Aug 2026) | Microsoft, NVIDIA, Anthropic USD 35bn | A |
| 6 | Nscale | H1 2026 USD 140.6m (+1,252% YoY, per S-1) | 1.3 GW+ pipeline | Not disclosed (only USD 2.6bn of USD 103.4bn signed is live) | USD 14.6bn (9 Mar 2026, Series C) | Microsoft USD 43.8bn; Anthropic USD 44.6bn | A |
| 7 | IREN | FY26 total revenue USD 707.0m; AI cloud USD 128.8m (about 8x YoY) | 5 GW+ pipeline | 0.81 GW | About USD 17.4bn (25 Sep 2026) | Microsoft USD 9.7bn; NVIDIA USD 3.4bn; Dell | A/C |
| 8 | Firmus | Not disclosed (FY27 H1 after-tax loss of A$77m expected) | 900 MW+ | 2 DCs (Australia, Singapore) | Over USD 10.5bn (Aug 2026 committed capital) | OpenAI (2 Malaysian sites); NVIDIA | A |
| 9 | Hut 8 | Q2’26 total USD 74.9m; Compute segment USD 72.5m | 949 MW (IT) | 0 (first energisation 2027 Q1) | About USD 11.9bn (28 Sep 2026) | Fluidstack USD 7.0bn; Beacon Point 2 x USD 9.8bn | C |
| 10 | Galaxy Digital | Q2’26 data centre adjusted EBITDA USD 11m; guidance about USD 80m per quarter at Phase I | 526 MW (signed) | About 133 MW IT | About USD 9.5bn (25 Sep 2026) | CoreWeave (sole tenant, 15 years) | C |
| 11 | Applied Digital | FY26 revenue USD 611.3m (+167%); Q4 HPC hosting USD 203.0m | 1,410 MW | 175 MW | About USD 7.65bn (25 Sep 2026) | CoreWeave 400MW/USD 11.0bn; 2 unnamed hyperscalers | C |
| 12 | Together AI | Annualised bookings over USD 1.15bn (Q2 2026, company figure) | 250 MW owned by YE26 (target) | — | USD 8.3bn (1 Jul 2026) | Cursor, Cognition, Decagon; Saudi HUMAIN | D |
| 13 | Fireworks AI | Annualised revenue over USD 1bn (Jul 2026, company figure) | Multi-cloud scheduling | — | USD 17.5bn (16 Jul 2026) | Cursor, Uber, Shopify, Notion, Perplexity | D |
| 14 | TeraWulf | Q2’26 total USD 44.8m; HPC leasing USD 31.9m (71%) | 839 MW | 102 MW IT | About USD 7.85bn (25 Sep 2026) | Anthropic 401MW/USD 19bn; FluidStack; Core42 | C |
| 15 | Core Scientific | Q2’26 colocation USD 136.7m (about 12.9x YoY); total USD 164.2m | About 1.1 GW | 437 MW (billed) | About USD 5.58bn (11 Sep 2026) | CoreWeave about 590MW/USD 10bn; AMD 530MW/USD 14bn | C |
| 16 | Cipher Digital | Q2’26 USD 24.84m (entirely from BTC mining; AI rent starts Aug 2026) | 700 MW (HPC) | 907 MW (existing grid capacity) | About USD 7.0bn (11 Sep 2026) | AWS 300MW/USD 5.5bn; FluidStack 168MW/USD 3bn | C |
| 17 | Baseten | About USD 600m annualised (end Q1 2026, company figure; about 20x YoY) | 18 clouds / 87 clusters | — | Up to USD 13bn (Jun 2026, Series F) | Cursor, Notion, Lovable, Harvey, HubSpot | D |
| 18 | Modal | About USD 300m annualised (May 2026, company figure; 5x in 8 months) | 13 partner clouds | — | USD 4.65bn (21 May 2026) | Cognition, Decagon, Suno, DoorDash, Ramp | D |
| 19 | Core42 | Not disclosed | Stargate UAE plans 1 GW | 25 MW (Jun 2026) to 100MW+ target | Not disclosed (parent G42) | UAE government, MBZUAI, Stargate UAE | A |
| 20 | Yotta (India) | Not disclosed (third-party estimate USD 96-256m not primary) | About 200 MW of facility capacity | 20,000+ Blackwell Ultra online | About USD 6bn target (IPO) / USD 4.4bn (Jul 2026 round) | NVIDIA DGX Cloud, Sarvam AI, IIT Madras | A |
Model column: A = owner-operated compute cloud; B = energy-integrated; C = landlord colocation; D = inference/serverless platform.
Principal sources: CoreWeave Q2 2026 release (11 Aug 2026) and DCD coverage (Aug 2026); Nebius Q2 2026 shareholder letter / SEC 6-K (12 Aug 2026); IREN FY26 8-K (27 Aug 2026); Applied Digital FY26 10-K; Core Scientific Q2 2026 release (28 Jul 2026); TeraWulf Q2 8-K (5 Aug 2026); Hut 8 Q2 2026 release (20 Jul 2026) and the 28 Sep 2026 revolver announcement; Galaxy Digital Q2 2026 (5 Aug 2026); Cipher Digital Q2 2026; Nscale S-1 (18 Sep 2026); Firmus draft prospectus (Reuters, 24 Sep 2026); financing announcements from private companies and TechCrunch / Bloomberg / Reuters coverage (see section 14).
Calibre warnings: (i) the revenue column mixes quarterly actuals, full-year guidance and annualised ARR, so it must not be ranked directly; (ii) Nscale’s USD 103.4bn ‘total signed’ against USD 2.6bn ‘live’ is a 40x gap — the widest in the sample; (iii) Crusoe has both a ‘4.9GW signed’ and a ‘6GW+ signed’ company figure; this report uses the 4.9GW disclosed in June 2026.
05 Scale and revenue comparison
To strip out fiscal-year differences, the chart below colours by the nature of the revenue: dark blue is company full-year guidance or forecast; green is the latest quarter annualised (x4); purple is company-stated ARR or annualised bookings. A logarithmic scale is used because the range spans USD 76m to USD 12,800m — two orders of magnitude.
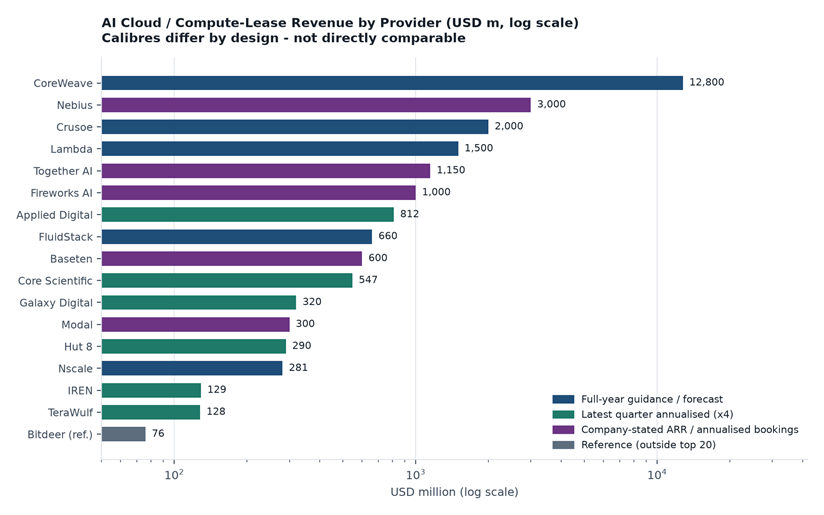
Figure: AI cloud / compute-lease revenue by provider (USD m, log scale)
Sources: as cited in the section 4 table. Note: CoreWeave’s USD 12.8bn is full-year guidance rather than revenue already earned, and Nebius’s USD 3.0bn is ARR rather than quarterly revenue x4. The two are not directly comparable in size, but together they convey the order of magnitude.
| Company | Amount (USD m) | Calibre type | Original disclosure |
| CoreWeave | 12,800 | Full-year guidance | FY2026 revenue guidance USD 12.4-13.2bn (midpoint); company release 11 Aug 2026 |
| Nebius | 3,000 | Company-stated ARR | AI cloud ARR USD 3.0bn (Q2 2026, +598% YoY) |
| Crusoe | 2,000 | Full-year forecast | 2026 revenue guidance about USD 2bn (third-party compilation, not primary) |
| Lambda | 1,500 | Full-year forecast | 2026 revenue expected above USD 1.5bn (media, to verify) |
| Together AI | 1,150 | Annualised bookings | Annualised bookings above USD 1.15bn (Q2 2026, company figure) |
| Fireworks AI | 1,000 | Annualised revenue | Above USD 1bn annualised (Jul 2026, company figure) |
| Applied Digital | 812 | Quarter annualised | Q4 FY26 HPC hosting revenue USD 203.0m x 4 |
| FluidStack | 660 | Full-year forecast | 2026 guidance about USD 660m (media/institutional memo, to verify) |
| Baseten | 600 | Annualised revenue | About USD 600m annualised (end Q1 2026, company figure) |
| Core Scientific | 547 | Quarter annualised | Q2’26 colocation revenue USD 136.7m x 4 |
| Galaxy Digital | 320 | Guidance annualised | Phase I about USD 80m per quarter x 4 (management guidance) |
| Modal | 300 | Annualised revenue | About USD 300m annualised (May 2026, company figure) |
| Hut 8 | 290 | Quarter annualised | Q2’26 Compute segment USD 72.5m x 4 |
| Nscale | 281 | Half-year annualised | H1 2026 USD 140.6m x 2 (S-1) |
| IREN | 129 | Fiscal-year actual | FY26 AI cloud services revenue USD 128.8m (FY25: USD 16.4m) |
| TeraWulf | 128 | Quarter annualised | Q2’26 HPC leasing USD 31.9m x 4 |
| Cipher Digital | n/a | Not charted | Q2’26 revenue was entirely BTC mining; AI rent starts Aug 2026 |
| Firmus / Core42 / Yotta | n/a | Not charted | Revenue not disclosed |
| Three things to keep in mind when reading this chart (i) The calibres are not comparable. Full-year guidance, quarter-annualised and ARR are mixed deliberately and only to build an order-of-magnitude intuition. (ii) Heavy-asset and platform revenue are different in kind — landlord revenue is rent (low margin, very long cycle, stable), while platform revenue is service fees (higher margin, short cycle, capable of vanishing quickly). (iii) Nscale’s USD 281m annualised sits against USD 103.4bn of signed value — a multiple of 368x, meaning the overwhelming majority of its contracts have not begun to recognise revenue. That is the single most important caution when assessing its S-1 valuation. |
06 Power: contracted versus live
Power is the one factor of production in this sector that cannot be replicated quickly with financing. The chart contrasts contracted power (the future revenue ceiling) with live or energised power (capacity that can bill today). The gap between them is the construction work each company must still deliver over the next 12-24 months, and therefore where execution risk is most concentrated.
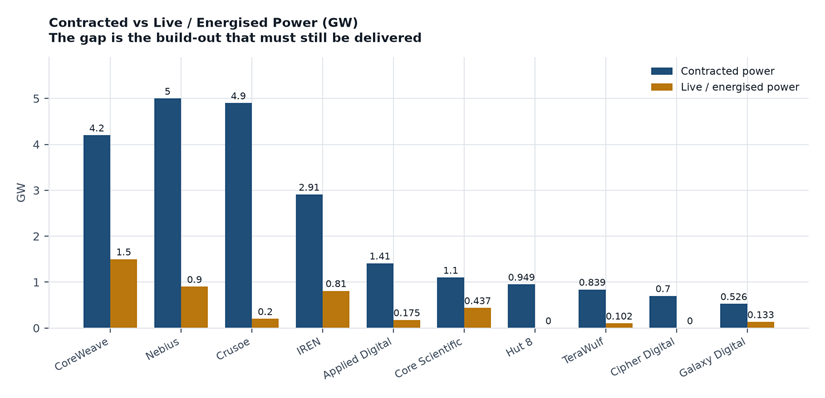
Figure: Contracted versus live / energised power (GW)
Sources: company 8-K / 10-K filings and Q2 2026 results, as cited in section 4. The definition of ‘contracted power’ is not uniform across companies (it variously includes signed PPAs, approved interconnection, or capacity covered by signed leases). This table is for order-of-magnitude and internal comparison only, not precise ranking.
| Company | Contracted (GW) | Live / energised (GW) | Gap multiple | Calibre and date |
| Nebius | 5.00 | 0.90 | 5.6x | Contracted target raised to 5GW for YE26; energised target 800MW-1GW (Q2’26 shareholder letter, 12 Aug 2026) |
| Crusoe | 4.90 | 0.20 | 24.5x | 4.9GW contracted and a 40GW+ development pipeline disclosed Jun 2026; about 0.2GW live (a 1GW figure also circulates, to verify) |
| CoreWeave | 4.20 | 1.50 | 2.8x | 4.2GW contracted (company figure, 11 Aug 2026); a 3.7GW figure also appears (Quartr transcript of the Q2 call). Live 1.5GW across 51 DCs, targeting 1.85GW by YE26 |
| IREN | 2.91 | 0.81 | 3.6x | 2,910MW contracted and energised at FY25 end; 810MW operating, 2,100MW under construction, 1,600MW in development (FY26 8-K, 27 Aug 2026) |
| Applied Digital | 1.41 | 0.18 | 8.1x | 1,410MW of contracted critical IT as of 31 May 2026 (FY26 10-K); 175MW live at Polaris Forge 1 |
| Core Scientific | 1.10 | 0.44 | 2.5x | About 1.1GW of leased customer power; 437MW billed in Q2’26 (release 28 Jul 2026) |
| Hut 8 | 0.95 | 0.00 | — | 949MW contracted IT, 1,330MW supporting power, about 8,660MW total pipeline; first energisation targeted 2027 Q1 (20 Jul 2026) |
| TeraWulf | 0.84 | 0.10 | 8.2x | Lake Mariner 438MW plus Justified 401MW; 102MW IT live (8-K, 5 Aug 2026) |
| Cipher Digital | 0.70 | 0.00 | — | 700MW of contracted HPC capacity; 907MW of existing grid capacity (AI not yet operational) |
| Galaxy Digital | 0.53 | 0.13 | 4.0x | CoreWeave committed to 526MW of critical IT across Phases I-III; about 133MW delivered at Phase I (Aug 2026) |
| Not charted | — | — | — | FluidStack (about 1.3GW planned for 2026 across 10+ sites, live undisclosed); Nscale (1.3GW+ pipeline, live MW undisclosed); Firmus (900MW+ contracted, live MW undisclosed); Core42 (Stargate UAE plans 1GW, 25MW live); Yotta (about 200MW of facility capacity) |
| The largest structural gaps: Crusoe at 24.5x, and TeraWulf / Applied Digital above 8x Contracted power is a proxy for work in progress. Crusoe has 4.9GW contracted against roughly 0.2GW live, meaning 96% of its revenue-generating capacity is not yet energised; TeraWulf and Applied Digital both exceed an 8x gap. These gaps must convert into physical delivery between 2027 and 2029, navigating grid queues, long lead times for transformers and turbines, and data centre moratoriums now appearing in several US states. By contrast, CoreWeave (2.8x) and Core Scientific (2.5x) have the smallest gaps and the most certain execution. |
07 Pricing and GPU rate comparison
Pricing is the only competitive dimension immediately visible to customers. The chart compares published on-demand rates for H100 and B200 (USD per GPU-hour, taking each provider’s lowest published tier). The red dashed line marks the lower bound of the hyperscaler range for an H100 SXM5 (USD 6/hr), illustrating the spread.
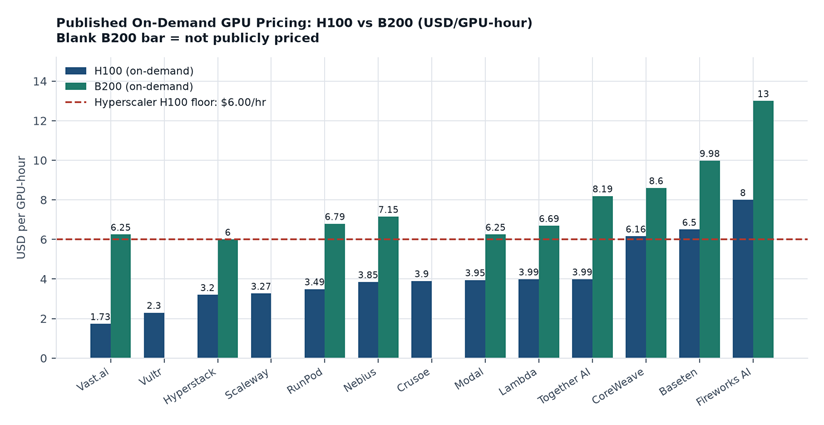
Figure: Published on-demand GPU pricing: H100 vs B200 (USD per GPU-hour)
Sources: official pricing pages read between 27 and 29 September 2026 (CoreWeave, Nebius, Lambda, Crusoe, Together AI, Fireworks AI, Modal, RunPod, Vast.ai, Baseten, Hyperstack, Scaleway); Vultr, SF Compute and Nscale figures come from third-party aggregators (not primary); the hyperscaler range is from Synergy Research / THE ELEC. Regional pricing, contract tenor and volume commitments differ, so list price is not the same as the transaction price.
| Provider | H100 (USD/hr) | H200 | B200 | B300 | Notes |
| Vast.ai | 1.73 from / 2.83 median | 2.63 from | 6.25 from | 8.13 from | Marketplace floor; interruptible tier a further 50%+ lower |
| SF Compute | about 1.82 | — | — | — | Third-party figure not primary; resale permitted |
| Nscale | about 2.29 | — | 7.49 | — | Third-party figure; sources conflict (USD 2.29 vs 3.49) to verify |
| Vultr | about 2.30 | — | — | — | MI300X at USD 1.85; fractional GPUs from USD 0.47 |
| Hyperstack | 3.20 | 3.99 | 6.00 | 7.40 | EU-West / UK regions only |
| Scaleway | 3.27 | — | — | 8.55 | B300 is an 8-GPU node divided per GPU; L40S at USD 1.68 |
| RunPod | 3.49 | 4.59 | 6.79 | 7.89 | Cheaper Community tier; serverless tier priced higher |
| Nebius | 3.85 | 4.50 | 7.15 | 7.85 | Rising about 20% from 1 Oct 2026: H100 to USD 4.50, B200 to USD 8.50, B300 to USD 9.50 |
| Crusoe | 3.90 | 4.29 | Not published | Not published | Only provider listing AMD MI300X at USD 3.45; A100 at USD 2.30, L40S at USD 1.50 |
| Modal | 3.95 | 4.54 | 6.25 | 7.10 | Per-second billing; non-preemptible tier at 3x |
| Lambda | 3.99 | Not published | 6.69 | Not published | Lowest published B200 on-demand rate; no spot tier |
| Together AI | 3.99 | 5.99 | 8.19 | 9.99 | Preemptible H100 at USD 1.99 |
| CoreWeave | 6.16 | 6.31 | 8.60 | spot 4.48 | GB200 NVL72 at USD 10.50; A100 at USD 2.70; spot H100 USD 2.46, B200 USD 4.26 |
| Baseten (dedicated) | 6.50 | — | 9.98 | — | Per-minute billing; A100 at USD 4.00 |
| Fireworks AI | 8.00 | 8.00 | 13.00 | 15.00 | GB300 at USD 20; includes inference-optimisation software premium |
| Hyperscaler (industry range) | 6.00-12.00 | — | — | — | Plus egress and storage charges (Synergy / THE ELEC basis) |
7.1 Three pricing routes
| Route | Billing unit | Examples | Customer experience | Vendor risk |
| Bare-metal GPU-hour | USD/GPU-hr, billed per second or minute | CoreWeave, Lambda, Nebius, Crusoe, RunPod | Predictable and reservable; suits training and large-scale inference | Prices fall fast with each generation; must be offset with new-generation premiums |
| Per-token | USD/1M tokens (input and output priced separately) | Groq, Together AI, Fireworks AI, Baseten | Zero ops, pay-as-you-go; suits application-layer teams | Squeezed from both sides by model owners and clouds; margin under pressure |
| Long-term capacity lease | USD/kW/month or a fixed annual rent | All landlords (Hut 8, Applied Digital, Cipher and others) | 10-20 year certainty, often with customer prepayment | Very late revenue recognition; high tenant concentration |
Per-token price anchors (USD per 1M tokens)
| Model tier | Cheapest provider | Input | Output |
| gpt-oss-20B (small open model) | Groq | USD 0.075 | USD 0.30 |
| gpt-oss-120B | Baseten | USD 0.10 | USD 0.50 |
| DeepSeek V4 Flash 0731 | Together AI | USD 0.14 | USD 0.28 |
| GLM-5.3-Flash | Baseten | USD 0.15 | USD 0.50 |
| MiniMax M3 | Fireworks AI | USD 0.30 | USD 1.20 |
| Kimi K3 (frontier open model) | Together AI / Fireworks AI | USD 3.00 | USD 15.00 |
Source: provider pricing pages read on 29 September 2026. Groq retired self-service access to Llama 3.1 8B and 3.3 70B on 16 August 2026, moving them to enterprise-only.
| Pricing has shifted from a race to the bottom to tiered increases — the most important signal reversal of 2026 For two years the Neocloud pitch was simply being cheaper than a hyperscaler. In 2026 the evidence points the other way: Nebius announced increases of about 20% across the board from 1 October 2026 (H100 from USD 3.85 to 4.50, B200 from 7.15 to 8.50, B300 from 7.85 to 9.50), while CoreWeave’s CEO stated explicitly that ‘Blackwell and Vera Rubin pricing and margins are at record highs, and previous-generation pricing is flat or higher than a few years ago’, adding that component cost inflation had been passed through to customers. This indicates that while supply remains tight and customers will pay for delivery certainty, pricing power has moved from buyer to seller — but only for sellers who can actually deliver. That is positive for landlords and owner-operators, and negative for small GPU sub-lessors betting on volume at falling prices. |
08 Capital expenditure and capital structure
This sector is fundamentally a combined engineering and financial-engineering contest. The table summarises the capital expenditure and project financing visible for 2026, with capital-structure detail listed separately — the cost of financing is itself a competitive variable: Hut 8 secured investment-grade construction debt at a 6.192% coupon, while part of IREN’s GPU financing carries a 9.0% cost. The margin of safety for those two companies bidding for the same customer differs enormously.
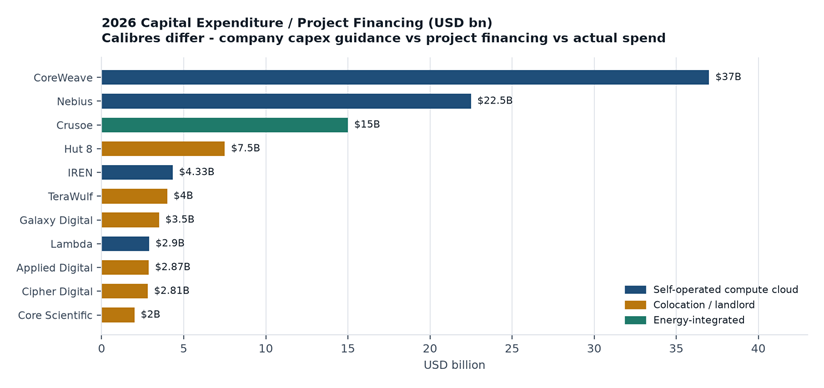
Figure: 2026 capital expenditure / project financing scale (USD bn)
Sources: company SEC filings and IR announcements, as cited in sections 4 and 8. Key calibre difference: CoreWeave and Nebius figures are company-wide capex guidance, while most others are project financing or actual spend to date. The three are not directly comparable.
| Company | Amount (USD bn) | Nature | Source and date |
| CoreWeave | 37.0 | FY2026 capex guidance (midpoint of USD 35-39bn) | Q2 2026 results, 11 Aug 2026 (Q2 actual USD 9.4bn) |
| Nebius | 22.5 | 2026 capex guidance (midpoint of USD 20-25bn) | Q2 2026 shareholder letter, 12 Aug 2026 (Q2 actual USD 5.66bn) |
| Crusoe | 15.0 | Cumulative capital deployed (including a USD 15bn JV) | Abilene Phase II USD 7.1bn construction loan (JPM-led) plus a USD 15bn Blue Owl / Primary JV |
| Hut 8 | 7.5 | Project financing (River Bend USD 3.25bn plus Beacon Point USD 4.25bn) | 6.192% / 6.129% coupons maturing 2042, rated BBB- / Baa2 (closed 30 Apr and 9 Jun 2026) |
| IREN | 4.33 | FY26 actual PP&E and hardware investment outflow | FY26 8-K, 27 Aug 2026 (plus USD 3.65bn of GPU financing completed) |
| TeraWulf | 4.00 | WULF Compute: USD 2.3bn spent plus USD 1.7bn remaining | Q2 2026 earnings call; unit cost guidance USD 8-10m per critical IT MW |
| Applied Digital | 2.87 | FY26 capex (FY25: about USD 0.68bn) | FY26 10-K (stepping up to about USD 600m per quarter) |
| Lambda | 2.90 | Total GPU-related debt in 2026 | USD 1bn senior secured facility (May 2026) plus USD 926m Term Loan B (27 Aug 2026) plus about USD 1bn of short-term private debt |
| Cipher Digital | 2.81 | USD 810m Stingray project debt plus about USD 2bn of high-yield notes (Black Pearl) | Stingray notes at a 6.0% coupon, 8x oversubscribed (8 Jun 2026) |
| Galaxy Digital | 3.50 | Helios Phase II senior secured notes | Completed Jul 2026 at an 85% loan-to-cost ratio |
| Core Scientific | 2.00 | 2026 capex target (assuming no new customer contracts) | Guidance of 6 May 2026; Q2 actual capex USD 797.5m |
8.1 Five tiers of financing capability (the core competitive stratification used in this report)
| Tier | Financing characteristics | Examples | Implication |
| T1 · Investment-grade project debt | Baa2/BBB- rated, coupon below 6.5%, up to 20-year tenor | Hut 8 (6.129-6.192%); CoreWeave DDTL 4.0 at USD 8.5bn (rated A3 / DBRS A(low)); Applied Digital, whose restructured lease via a CoreWeave SPV achieved an A3 rating | The scarcest capability in the sector. Those who can finance at investment-grade cost can quote a lower price to the same customer |
| T2 · High-yield debt / secured loans | Coupons of 6.75-9.25%, tenor 5-8 years | Applied Digital (6.75% / 7.00% / 9.25%); IREN (USD 2.4bn at 9.0% fixed, plus SOFR+213/225bps); Core Scientific (USD 3.3bn at 7.75%); CoreWeave DDTL 5.5 (SOFR+5.50%) | Available, but the spread is very wide; over a ten-year cycle the difference between 9% and 6% can consume the entire net margin |
| T3 · Customer prepayment / lease guarantees | Prepayment covering 45-70% of capex plus third-party credit support | Nebius (over USD 9bn of prepayments expected, covering 50-60% of capex); IREN (prepayments 45-55% of GPU capex); TeraWulf, Hut 8 and Cipher (Google providing rent guarantees) | A financing structure unique to this sector: using the customer’s balance sheet to fund your own construction. Google is the largest invisible credit provider of this cycle (about USD 3.2bn for TeraWulf, USD 1.4bn for Cipher and about USD 1.8bn of lease guarantees for FluidStack) |
| T4 · Large equity rounds | Single rounds of USD 1.5-3.9bn at valuations of USD 8-31bn | Crusoe USD 3.9bn at USD 30.9bn; Nebius USD 5.75bn convertibles; FluidStack USD 1.5bn at USD 18bn; Fireworks USD 1.505bn; Baseten USD 1.5bn; Lambda (in talks for USD 3bn) | Private-market liquidity in 2026 is abundant, which is the direct cause of elevated multiples |
| T5 · Constrained | Undisclosed financials, reliant on a parent, or dependent on government subsidy | Core42 (reliant on G42 and the UAE); Sesterce (entered French judicial restructuring in Feb 2026); Civo (net assets of negative GBP 11.2m) | Availability is uncertain and project progress depends on external decisions |
| An investor angle the market underestimates Google is becoming the largest invisible credit guarantor in the Neocloud ecosystem: it provides TeraWulf with cumulative rent guarantees of about USD 3.2bn in exchange for roughly 14% of potential equity; guarantees USD 1.4bn of Cipher’s obligations to FluidStack in exchange for about 5.4% of the equity; guarantees about USD 1.8bn of FluidStack’s own lease obligations; and hosts up to one million Google TPUs inside FluidStack’s custom data centres. This is a fundamentally different route from a hyperscaler building its own assets: Google avoids the heavy capital and instead trades credit support for capacity priority and equity upside. For assessing counterparty risk in these projects, the presence of a Google guarantee materially improves the bankability of the leases — but it also means that if the AI capital-expenditure cycle turns, Google will be the first to pull back its guarantee commitments. |
09 Customer profiles and contract topology
9.1 The real structure of demand: who is buying compute
Neocloud customers are heavily concentrated in four buyer types, and their behaviour differs sharply.
| 1 · Frontier model labs | OpenAI, Anthropic, xAI, Mistral, Cohere Characterised by very large, very long, prepay-friendly orders. Anthropic alone bet on three providers in 2026 — Lambda (USD 35bn / 6 years), TeraWulf (USD 19bn / 20 years) and FluidStack (USD 50bn) — committing over USD 100bn in total. These customers underpin Neocloud valuations and are simultaneously the single largest point of failure. |
| 2 · Hyperscalers | Microsoft, Meta, Google, Oracle, Amazon/AWS Characterised by substituting leases for self-built capex. Microsoft has committed upwards of USD 60bn cumulatively to Neoclouds (Nebius USD 17.4-19.4bn, Nscale USD 43.8bn, IREN USD 9.7bn, Lambda several billion). Meta has committed about USD 35bn to CoreWeave, USD 27bn to Nebius and 1.6GW to Crusoe. |
| 3 · Application and developer platforms | Cursor, Notion, Perplexity, Shopify, Harvey, Uber, Lovable Characterised by small-ticket, high-frequency demand where stickiness comes from software rather than hardware. 95% of Fireworks AI revenue comes from customers’ customised models; Cursor was once about half its revenue and has since diversified. Baseten’s customer base is mainly developer-tools companies. |
| 4 · Sovereign, government and financial | Core42 in the UAE, IndiaAI Mission, Jane Street, MBZUAI Characterised by compliance first and low price sensitivity. Jane Street has simultaneously committed USD 6bn of cloud plus USD 1bn of equity to CoreWeave, signed a five-year contract worth about USD 13bn with Crusoe and led FluidStack’s USD 1.5bn round — quantitative funds are now among the most active buyers of AI compute. |
9.2 Contract topology: who serves whom
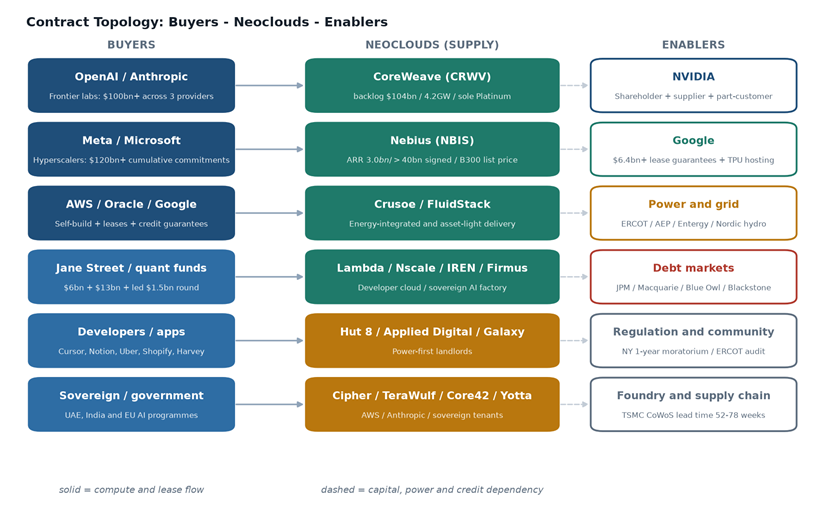
Note: the diagram is illustrative and lines do not imply exclusive relationships. Amounts are on the calibres set out in section 4. The Google guarantee figure is the approximate sum of USD 3.2bn for TeraWulf, USD 1.4bn for Cipher and about USD 1.8bn for FluidStack.
10 Technical differentiation and best-fit scenarios
The table below is a quick reference for the technical edge and scenario fit of all 20 providers. ‘Best-fit’ and ‘not suitable for’ deserve equal weight — the most common error in this sector is equating the largest scale with the best fit. A scenario-matching matrix follows the company cards.
1. CoreWeave
Sole Platinum rating in ClusterMAX 2.0 (three times running)
Technical edge: Fully interconnected InfiniBand with GPUDirect RDMA; Kubernetes-native scheduling; first to bring up and validate NVIDIA’s Vera Rubin NVL72; MLPerf records; standardised delivery across 51 data centres.
Best fit: frontier model training (10,000+ GPUs, multi-year) and the most demanding production inference with enterprise SLAs, plus listed-company customers that require audited financials from their supplier.
Not suitable for: highly budget-sensitive experimental workloads, or price-sensitive batch processing (it sits at the top of the price range).
2. Nebius
ClusterMAX 2.0 Gold · NVIDIA Exemplar Provider
Technical edge: InfiniBand at 3,200 Gbps; the only published B300 on-demand rate; over 75% of its data centres are self-built rather than subleased; among the first to take delivery of Vera Rubin NVL72; MLPerf B200 records; EU and Nordic data-residency compliance.
Best fit: frontier training on the newest B300 architecture; compliance-driven training that must reside in Europe; low-cost spot experimentation (preemptible H100 at USD 2.15).
Note: prices rise about 20% from 1 October 2026 — the low-price window is closing.
3. Crusoe
ClusterMAX 2.0 Gold · The only AMD full stack
Technical edge: Energy integration (stranded and flared gas, about 7GW identified) plus Form Energy 12GWh iron-air batteries; the only provider listing AMD MI300X and MI355X at published rates; liquid cooling; owner-operated dual Abilene campuses totalling 2.1GW.
Best fit: very large, long-cycle training where power cost dominates; AMD ROCm validation and de-NVIDIA-risking; Stargate-scale gigawatt custom delivery.
Not suitable for: short-cycle demand needing immediate B200/GB200 delivery (no published rates).
4. FluidStack
Not covered by the ClusterMAX rating
Technical edge: An asset-light ‘match and energise fast’ model claiming six-month energisation against an industry norm of 18-24 months; Atlas OS automates bring-up; InfiniBand capable of over 12,000 GPUs in a single job; hardware validated to at least 95% of theoretical performance; zero ingress and egress fees.
Best fit: dedicated custom capacity for frontier labs (Anthropic at USD 50bn); Google TPU stack hosting (up to one million chips); requirements needing extremely fast energisation.
Not suitable for: developers needing published rates and self-service onboarding, or procurement that requires third-party reliability ratings.
5. Lambda
ClusterMAX 2.0 Silver
Technical edge: Quantum-2 / Quantum-X800 InfiniBand with co-packaged optics; 1-Click Clusters self-service from 16 to 2,048 GPUs; the Lambda Stack deep-learning environment; zero egress fees; SOC 2 Type II.
Best fit: mid-to-large-scale fine-tuning and pre-training for AI research teams (16-512 GPUs); cost-conscious on-demand B200 at USD 6.69, the lowest published rate in the sample.
Not suitable for: workloads that need spot or preemptible cost reduction (no spot tier exists), or anything requiring Asia-Pacific nodes (all US).
6. Nscale
S-1 filed, targeting NYSE: NSCL
Technical edge: Full-stack self-built data centres plus modular capability acquired with Kontena in 2024; liquid cooling; Nordic hydro power arbitrage; 200,000 GB300 chips signed.
Best fit: sovereign AI programmes (UK, Norway, Portugal, Iceland, West Virginia) and very large contracts requiring European execution.
Major warning: the S-1 contains going-concern language; H1 losses were seven times revenue; only USD 2.6bn of USD 103.4bn signed is live; UK power prices at roughly four times US/Nordic levels caused the Stargate UK pause, and the Guardian reported the flagship Loughton site was still a scaffolding site.
7. IREN
NVIDIA GB300 NVL72 Exemplar Cloud certified
Technical edge: Vertical integration (owned land, interconnection, data centres and GPUs); direct-to-chip liquid cooling across Childress Horizon 1-4; the acquisition of Mirantis in August 2026 added the cloud orchestration software layer; claims 100% renewable energy.
Best fit: hyperscale customers wanting controllable self-built capacity; dual-region demand across Australia/Asia-Pacific and North America; GPU-as-a-service with owned and operated GPUs.
Not suitable for: buyers highly sensitive to leverage and impairment (FY26 impairments of USD 638.8m and a net loss of USD 702.6m; some GPU financing at 9.0%).
8. Firmus
ASX listing scheduled for 22 October 2026
Technical edge: HyperCube modular immersion and direct-to-chip liquid cooling claiming 30% lower energy, 99% lower water use and a PUE of 1.03 (the PUE figure is questioned within the industry); over A$300m invested in a local supply chain with 1.5GW of annual build capacity.
Best fit: Southeast Asian deployment — 360MW at Batam, Indonesia (with DayOne, 170,000 accelerators) plus two Malaysian sites supplying OpenAI; sovereign capacity in Australia.
Not suitable for: buyers requiring audited financials and a track record of delivery (the IPO has slipped from June to October, with valuation estimates ranging incoherently from USD 15.5bn to USD 60bn).
9. Hut 8
First single-sponsor investment-grade construction-period data centre debt
Technical edge: Power-first underwriting — securing interconnection before signing customers; the first data hall redesigned to NVIDIA’s DSX reference architecture, delivering 57% more IT capacity within the same land and power footprint; project-level non-recourse investment-grade financing.
Best fit: hyperscale tenants demanding an investment-grade counterparty and Google guarantees; frontier labs needing incremental capacity from 2027 onwards (704MW IT at Beacon Point).
Not suitable for: customers needing output in 2026 — live power is zero, with first energisation targeted for Q1 2027.
10. Galaxy Digital
ERCOT Batch Zero large-load classification
Technical edge: A single permitted campus of 1.63GW at Helios, expandable to 3.6GW; Phase I delivered on time and on budget at 200MW gross; HITT Contracting as general contractor; project-level adjusted EBITDA margin target above 90%.
Best fit: a single tenant needing very large scale, low power prices and rapid energisation in West Texas (CoreWeave at 526MW over 15 years, over USD 1bn a year).
Major warning: the remaining 830MW of permitted capacity still has no tenant (the CEO had expected to lease it by late summer 2026, but no tenant was announced at Q2); Q2 revenue of USD 8.56bn missed expectations by about USD 3bn and the shares fell over 13% in a day.
11. Applied Digital
Pioneer of 100MW-class direct-to-chip liquid-cooled halls
Technical edge: 100MW-class liquid-cooled halls; near-zero WUE design; precast concrete for rapid build; 1,200 tradespeople working in parallel; underpinned by a USD 5bn Macquarie perpetual preferred equity facility.
Best fit: hyperscalers wanting a turnkey AI Factory (Polaris Forge 1-3 and Delta Forge 1-2, 1,410MW contracted in total).
Major warning: only USD 451m of rent will be recognised in FY27 against USD 36.2bn of total contract value; a single HPC customer was 59% of FY26 continuing-operations revenue; USD 5.0bn of debt carries restrictive covenants; the perpetual preferred ranks ahead of common equity.
12. Together AI
Hosting 200+ open models
Technical edge: FP4 quantisation; speculative decoding; sub-500ms time to first token; asynchronous batch up to 30bn tokens; OpenAI-compatible API; sandbox, storage and fine-tuning in one platform.
Best fit: high-throughput, low-cost inference on open models; combined fine-tuning and hosting; application teams that need to switch among 200+ models.
Not suitable for: regulated industries needing hardware-level isolation and compliance certifications, or workloads needing Asia-Pacific nodes.
13. Fireworks AI
Proprietary FireAttention CUDA kernels (V1 to V3)
Technical edge: FireAttention delivers up to 12x acceleration on long context; FireOptimizer automatically searches over 100,000 parameter combinations; Multi-LoRA supports up to 100 adapters per deployment; semantic caching; claims one third the latency of generic solutions and 5-10x lower cost than comparable closed models (company figures).
Best fit: production deployment of fine-tuned and post-trained models; long-context workloads; enterprises needing multi-model routing and LoRA reuse.
Not suitable for: pure bare-metal procurement (GPU rates of USD 8-20 are the highest in the sample); gross margin is only about 50% (third-party estimate).
14. TeraWulf
Reusing the dual 345kV interconnection of a retired coal plant
Technical edge: Reusing retired coal plant infrastructure avoids years of transmission build; closed-loop liquid cooling (about USD 290m supplied by Schneider Electric); targeting 250-500MW of new critical IT signed each year; HPC leasing is already 71% of revenue.
Best fit: very large labs needing 20-year certainty (Anthropic at 401MW and about USD 19bn); leases requiring Google-grade credit support.
Major warning: adjusted EBITDA of negative USD 18.3m; 68% project-level debt; dependence on a single anchor tenant and on Google’s guarantee; clean-power claims lack a verifiable mechanism.
15. Core Scientific
Behind-the-meter generation to bypass the interconnection queue
Technical edge: Reuse of already-energised mining infrastructure; behind-the-meter gas generation online in about 24 months, sidestepping the interconnection queue; advance procurement of long-lead equipment compresses ready-for-service to 12-14 months; build cost of about USD 11m per MW.
Best fit: long-term colocation for CoreWeave and AMD (about 1.1GW combined, over USD 24bn of potential contracted revenue); large tenants able to energise within 12-14 months.
Major warning: CoreWeave was about 77% of H1 2026 total revenue; USD 4.3bn of debt against USD 1.82bn of liquidity; warrant remeasurement drove a single-quarter GAAP loss of USD 1.155bn.
16. Cipher Digital
ERCOT Batch Zero queue position
Technical edge: Black Pearl, Barber Lake, Stingray and Apollo all sit inside the ERCOT Batch Zero queue; an AEP Direct Connect agreement gives Colchis a dual interconnection point (energised 2028); direct-to-chip liquid cooling plus closed-loop immersion to avoid municipal water limits; modular offsite construction (the original mining site was built in 16 months).
Best fit: very large tenants needing exceptionally low power costs (a long-term fixed PPA at Odessa around 2.72-2.8 US cents/kWh); long-term colocation for AWS-grade investment-grade tenants.
Major warning: Q2 2026 revenue was still 100% from BTC mining; Q2 interest expense was 2.7x quarterly revenue; USD 6.02bn of debt against USD 832m of unrestricted cash; the Odessa PPA expires on 31 July 2027.
17. Baseten
Automated routing across 18 clouds and 87 clusters
Technical edge: The open-source Truss packaging framework; Firecracker-class micro-VMs; cold-start snapshots bringing a 20GB model online in under 10 seconds; the Chains SDK for multi-model orchestration; a strategic collaboration agreement with AWS; acquisitions of Parsed (RL and post-training) and Blaxel (agent execution infrastructure).
Best fit: production-grade multi-model and fine-tuned model serving; enterprise multi-model routing and failover; agent runtimes.
Not suitable for: training that needs the performance ceiling of bare metal, or procurement requiring the supplier to own compute. Valued at about 22x ARR, the highest in the sample.
18. Modal
First to run gVisor at scale on GPUs
Technical edge: A Rust-built scheduler starting containers in seconds; the first to run gVisor on GPUs at scale for strong isolation; a FUSE content-addressed filesystem; Python-native primitives (Function, Sandbox, Volume, Cron); over one billion sandboxes launched cumulatively.
Best fit: bursty and unpredictable inference; agent code-execution sandboxes (now more than a third of revenue); short fine-tuning and RL jobs.
Not suitable for: long-reserved bare-metal training, or regulated industries needing compliance certifications (no public certifications).
19. Core42 (G42)
NVIDIA, AMD and Cerebras in one heterogeneous stack
Technical edge: The only Gulf cloud provider licensed to acquire advanced NVIDIA silicon at scale under US export controls; a heterogeneous NVIDIA + AMD + Cerebras stack; a self-service Core42 AI Cloud platform launched in October 2025 delivering across jurisdictions; Stargate UAE’s first 200MW phase on GB300.
Best fit: Middle Eastern sovereign AI programmes; Gulf customers needing a compliant US export pathway; Condor Galaxy-scale inference (built with Cerebras).
Major warning: financials are completely opaque; dependent on US export-control policy (geopolitical risk); Iran has warned of strikes on Gulf data centres and similar regional infrastructure.
20. Yotta Data Services
Over 20,000 Blackwell Ultra online
Technical edge: Shakti Cloud; ordering 50,000 Vera Rubin and 45,000 GB300 chips (Rubin including networking at about USD 7.5bn); plans to deploy 80,000 Vera Rubin chips across two new facilities; campuses at Navi Mumbai, Greater Noida and GIFT City. The CEO claims 60-70% of India’s installed GPU capacity.
Best fit: Indian sovereign AI (IndiaAI Mission-class orders); international customers needing South Asian low latency (about 75-80% of customers are international).
Major warning: about 200MW of facility capacity is insufficient to run 80,000 GPUs at full load; TSMC CoWoS lead times of 52-78 weeks; the NVIDIA Kyber rack (about 600kW) transition in H2 2027 will require power retrofits; a single-source report of a customer server compromise (to verify).
10.1 Six-dimension capability rating (subjective assessment by this report, based on the public data above)
To avoid the trap of ranking on scale alone, the chart below scores eight representative companies across six dimensions. The scores are a subjective judgement by this report based on public data (1-5), not a third-party rating, and are intended to show relative structure rather than to serve as an investment basis.
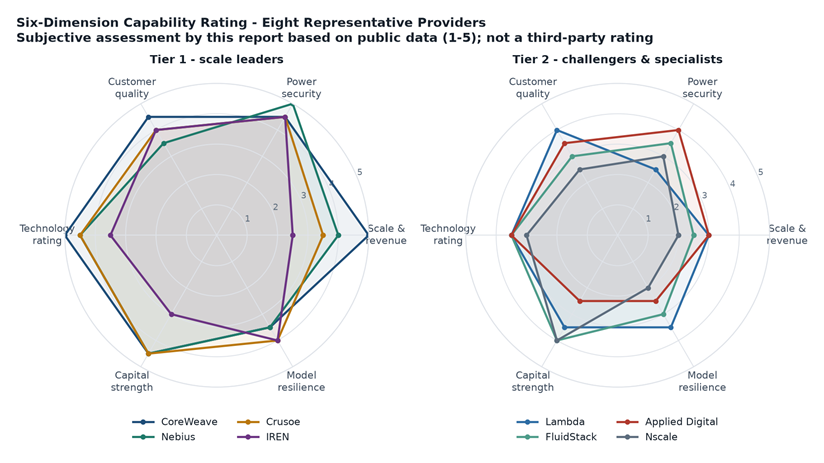
Figure: Six-dimension capability rating — eight representative providers
Scoring basis: (1) Scale and revenue — order of magnitude and growth from section 5; (2) Power security — contracted power scale, energy cost, interconnection certainty; (3) Customer quality — counterparty credit rating, contract tenor, customer diversification (note: high customer concentration is penalised here); (4) Technology rating — third-party ClusterMAX rating, network architecture, liquid-cooling capability, proprietary software; (5) Capital strength — cost and tenor of financing, available cash; (6) Model resilience — ability to withstand generational GPU depreciation and customer bargaining power. These scores are a subjective judgement by this report, not a third-party rating, and must not be used as a basis for investment.
| Company | Scale & revenue | Power security | Customer quality | Technology rating | Capital strength | Model resilience | Total |
| CoreWeave | 5.0 | 4.5 | 4.5 | 5.0 | 4.5 | 3.5 | 27.0 |
| Nebius | 4.0 | 5.0 | 3.5 | 4.5 | 4.5 | 3.5 | 25.0 |
| Crusoe | 3.5 | 4.5 | 4.0 | 4.5 | 4.5 | 4.0 | 25.0 |
| IREN | 2.5 | 4.5 | 4.0 | 3.5 | 3.0 | 4.0 | 21.5 |
| Lambda | 3.0 | 2.5 | 4.0 | 3.5 | 3.5 | 3.5 | 20.0 |
| FluidStack | 2.5 | 3.5 | 3.0 | 3.5 | 4.0 | 3.0 | 19.5 |
| Applied Digital | 3.0 | 4.0 | 3.5 | 3.5 | 2.5 | 2.5 | 19.0 |
| Nscale | 2.0 | 3.0 | 2.5 | 3.0 | 4.0 | 2.0 | 16.5 |
10.2 Scenario-matching matrix
| Workload scenario | First choice | Alternatives | Not recommended / needs caution |
| Frontier model training (10,000+ GPUs, multi-year) | CoreWeave (Platinum reliability), Nebius (early B300 capacity) | Crusoe (energy cost advantage), IREN, Nscale (Europe / sovereign) | Groq (LPU roadmap ended), Modal / Baseten (no owned compute) |
| Mid-scale training and fine-tuning (16-512 GPUs, weeks to months) | Lambda (self-service 1-Click Clusters) | Nebius on-demand B200/B300, Crusoe H200 at USD 4.29 (cheapest Hopper tier) | Hut 8 / Cipher (no capacity before 2027) |
| Budget-sensitive experiments and fault-tolerant batch | Vast.ai (H100 from USD 1.73, the floor) | Nebius preemptible H100 at USD 2.15, CoreWeave spot H100 at USD 2.46, RunPod Spot (up to 80% cheaper) | Fireworks AI / Baseten (USD 8-20 tier, paying purely for software) |
| High-throughput, low-cost inference | Fireworks AI (over USD 1bn annualised, 40tn tokens a day) | Together AI, Baseten (18-cloud auto-routing), CoreWeave managed inference (USD 100m to USD 250m ARR) | Vast.ai (no SLA; hosts can inspect containers) |
| Ultra-low-latency streaming / voice | GroqCloud (LPU deterministic spatial dataflow, a historic strength) | Modal (gVisor isolation with second-level starts) | Landlords (no inference platform layer) |
| Agent code-execution sandboxes | Modal (over a billion sandboxes, over a third of revenue) | Baseten (Chains SDK plus Blaxel execution infrastructure) | Bare-metal GPU rental (no sandbox isolation) |
| AMD / de-NVIDIA-risking validation | Crusoe (the only published MI300X / MI355X rates) | Vultr (MI300X at USD 1.85), Core42 (AMD plus Cerebras) | All others are NVIDIA-only |
| Google TPU stack | FluidStack (hosts up to one million Google TPUs) | — | — |
| Sovereign AI / data compliance | Core42 (UAE), Nscale (UK/Nordics), Firmus (Australia/SE Asia), Yotta (India) | Scaleway (EU, GDPR/HDS, SecNumCloud application pending), Nebius (EU sites) | US-only providers (Lambda, Core Scientific) |
| Southeast Asian localised deployment | Firmus (360MW Batam plus two Malaysian sites) | Bitdeer (2MW Cyberjaya, 21MW Johor Bahru GB300 NVL72), Vultr (Singapore) | Note: Vultr’s official region list contains no Malaysia; Singapore is its Southeast Asian node |
| Supplier must have audited financials | CoreWeave, Nebius (SEC 10-Q / 6-K) | IREN, Hut 8, Applied Digital, Core Scientific, TeraWulf, Cipher, Galaxy (all Nasdaq-listed) | All unlisted private companies (no audited disclosure) |
11 OPEX structure and unit economics
The OPEX structure of this sector is entirely different from a hyperscaler’s: depreciation and interest together can exceed half of revenue, and neither falls when utilisation falls. Economies of scale therefore do not arrive automatically in this industry. The available unit-economics data is set out below.
| Metric | Figure | Company / source | Implication |
| Technology and infrastructure expense | USD 1,510m in Q2’26 alone (versus USD 670m a year earlier) | CoreWeave Q2 2026 | Up 125% year on year, broadly matching revenue growth, though the absolute figure already exceeds half of revenue |
| Net interest expense / revenue | About 25% (Q2’26 net interest expense of USD 640m on revenue of USD 2,575m) | CoreWeave Q2 2026 | This is the direct cause of the USD 626m GAAP loss. A 59% adjusted EBITDA margin alongside a net loss shows the core business is profitable but the capital structure consumes the profit |
| Project-level EBITDA margin | Above 90% on landlord leases | Galaxy Digital Q2 2026 guidance | Landlord unit economics are excellent (about USD 2.17m of EBITDA per critical IT MW), at the cost of very late revenue recognition |
| Data centre build cost | USD 8-10m per critical IT MW (TeraWulf, now estimated about USD 9.1m); about USD 11m/MW (Core Scientific) | TeraWulf Q2 call; Core Scientific | The industry range has converged to USD 9-11m per IT MW; anyone outside it needs to explain why |
| Revenue per IT MW under tenant guidance | Above USD 20m per IT MW over a three-year contract (around USD 25m in current negotiations) | IREN FY26 8-K | For landlords, USD 20-25m of revenue per IT MW implies roughly a two-year payback and is the key anchor for assessing lease quality |
| Power cost | 2.72-2.8 US cents/kWh (Cipher’s fixed PPA at Odessa); 3.3-4.3 cents/kWh (IREN at Childress); USD 44/MWh (Bitdeer Q2’26 average); USD 52/MWh (Q1’26) | Company disclosures | Against US commercial electricity at 10-12 cents/kWh, locking low-cost power at a 300MW site creates a structural cost advantage of roughly USD 183m a year (third-party calculation) |
| Cloud and Kubernetes gross margin | About 50% (Fireworks AI, third-party estimate); about 58% (Bit Digital cloud services, Q2’26); about 63% (Bit Digital colocation) | Sacra; Bit Digital release | Platform gross margin is materially lower than landlord gross margin — the key to the divergence between valuation multiples and margins |
| PUE (energy efficiency) | About 1.1 (Bitdeer’s Tydal site, closed-loop water cooling); 1.03 (claimed by Firmus, questioned within the industry) | Bitdeer 6-K; Firmus | 1.1 is the realistic benchmark for current liquid-cooling designs; claims below 1.05 usually reflect a different measurement convention |
| The most easily overlooked OPEX item: the assumed GPU depreciation life This report was unable to obtain a complete comparison of each company’s GPU depreciation policy (disclosure granularity differs, and this is an acknowledged data gap). What is certain is that there is a structural mismatch between 15-20 year lease terms and a 4-6 year GPU depreciation life. CoreWeave’s CEO stated on the Q2 call that ‘Blackwell and Vera Rubin pricing and margins are at record highs, while previous-generation pricing is flat or higher than a few years ago’, and noted a recently signed A100 contract running into 2029 (the A100 launched in 2020) — direct counter-evidence to the assumption of rapid GPU obsolescence. But the strength of that counter-evidence depends on whether inference demand (rather than training demand) can absorb older silicon for another five years. If it can, current aggressive depreciation is actually understating asset life. If it cannot, every valuation offered on ‘EBITDA before depreciation’ is systematically too high. This report considers it the single most important variable to keep tracking. |
12 Risk register and contrarian view
12.1 Seven systemic risks (ordered by this report’s assessment of importance)
| # | Risk | Evidence | Most exposed |
| 1 | Customer concentration — the industry’s largest hidden risk | Meta plus Microsoft are roughly 94-95% of Nebius’s disclosed backlog; Microsoft and Anthropic are 85% of Nscale’s contracted value; CoreWeave is about 77% of Core Scientific revenue; a single HPC customer was 59% of Applied Digital’s FY26 continuing-operations revenue; CoreWeave is Galaxy Digital’s only tenant; Hut 8’s two campuses share one tenant | Nscale, Core Scientific, Galaxy, Applied Digital, Nebius |
| 2 | Contract tenor versus asset life mismatch | 15-20 year leases against a 4-6 year GPU depreciation life; Applied Digital holds USD 36.2bn of contract value but will recognise only USD 451m in FY27; Nscale has USD 103.4bn signed against USD 2.6bn live | All landlords, plus Nscale |
| 3 | Circular financing and related-party transactions | NVIDIA is simultaneously a shareholder and the sole GPU supplier to CoreWeave (USD 2bn in Jan 2026), Nebius (USD 2bn in Mar 2026), Nscale (USD 1bn convertible in Sep 2026), Firmus, Vultr, Volta, Lambda and Baseten (USD 150m); Lambda leases about 18,000 GPUs back to NVIDIA (USD 1.5bn); CoreWeave carries a USD 6.3bn backstop purchase obligation to NVIDIA. In Mar 2026 US senators Warren and Blumenthal wrote to NVIDIA raising antitrust concerns over the Groq licensing transaction | Lambda, Nscale, Firmus, CoreWeave |
| 4 | Divergent financing costs and leverage | Hut 8 at an investment-grade 6.129-6.192% versus IREN at 9.0% on part of its GPU financing; Cipher with USD 6.02bn of debt against USD 832m of unrestricted cash and Q2 interest expense at 2.7x revenue; Applied Digital with USD 5.0bn of debt and perpetual preferred ranking ahead of common; Core Scientific with about USD 4.3bn of debt against USD 1.82bn of liquidity | Cipher, Applied Digital, Core Scientific, Bitdeer |
| 5 | Power and interconnection execution risk | Crusoe has 4.9GW contracted but about 0.2GW live (a 24.5x gap); TeraWulf and Applied Digital exceed 8x; TSMC CoWoS lead times of 52-78 weeks; the NVIDIA Kyber rack (about 600kW) transition in H2 2027 will require retrofits to existing facilities; data centre moratoriums in several US states (New York imposed a one-year moratorium on 15 July 2026) | Crusoe, TeraWulf, Applied Digital, Hut 8, Yotta |
| 6 | Regulation and community opposition | CoreWeave’s CEO acknowledged that ‘when parts of the US are not even willing to have these conversations, things get harder’; TeraWulf faces the New York moratorium; Sesterce’s EUR 1.5bn Valence project permit was suspended by an administrative court; the ERCOT Batch Zero queue slipped following a Texas governor’s audit directive | All US-based physical projects |
| 7 | The lag between valuation multiples and actual delivery | FluidStack at USD 18bn against 2026E revenue of about USD 660m is roughly 27x; Baseten at up to USD 13bn against about USD 600m ARR is roughly 22x; Fireworks at USD 17.5bn against over USD 1bn annualised is roughly 17.5x. Landlord multiples depend even more heavily on forward contract value (Applied Digital at USD 7.65bn of market cap against USD 451m of FY27 rent) | FluidStack, Baseten, Fireworks, Applied Digital |
12.2 Contrarian view: what the market knows, and what may not yet be priced
| What is already fully priced in That the AI compute shortage is structural, that Neoclouds are direct beneficiaries, that tight GPU supply is pushing prices and margins up, and that power is the core scarce input. These judgements are already reflected in CoreWeave’s USD 104bn backlog, Nebius’s 454% growth and Synergy’s USD 400bn (2031) forecast. |
| Three things that are not yet fully priced (this report’s view) (i) The lag between contract value and cash flow is systematically underestimated. The industry is being priced on backlog, yet the economic value of backlog depends heavily on delivery capability and discount assumptions. Applied Digital is the clearest case: USD 36.2bn of contract value against USD 451m recognised in FY27 — 0.12%. When the market simultaneously values such companies on total contract value, any delivery delay triggers non-linear re-pricing. (ii) The single-tenant risk of the landlord model is being masked by third-party guarantees. Google trades roughly USD 6.4bn of rent guarantees for about 14% of potential TeraWulf equity and about 5.4% of Cipher’s. On the surface this transfers counterparty risk; in substance it concentrates that risk onto one balance sheet. If the AI capex cycle turns, Google will be the first institution to pull back its guarantee commitments — at which point both the bankability and the valuation support for these leases weaken at the same time. (iii) Platform (Model D) valuations may be mis-framed by analogy to the heavy-asset players. Modal grew from about USD 60m to about USD 300m annualised in eight months (5x); Baseten from about USD 200m to about USD 600m ARR (about 3x, or roughly 20x year on year) — far faster than the heavy-asset players. Yet the market discounts and questions them on the grounds of having no owned compute and being easily substituted. The reverse possibility: if inference demand grows faster than training demand, and if cost optimisation (FireAttention, FlashBoot, gVisor isolation) constitutes a genuine moat, then 22x ARR at the platform layer may not be more expensive than the multiples implied by forward contract value at the landlord layer. This disagreement will be settled in 2027. |
| The single name with the densest risk signals (this report’s view, not investment advice) Nscale carries the highest concentration of warning signs among all 20: going-concern language in the S-1, H1 losses at seven times revenue, USD 103.4bn signed against USD 2.6bn live (a 40x gap), 85% customer concentration, UK power prices at roughly four times US/Nordic levels prompting OpenAI to pause Stargate UK, and a flagship Loughton site the Guardian reported as still a scaffolding site. Its USD 14.6bn valuation rests on an execution record that has not yet been proven. Conversely, CoreWeave and Nebius are the only two combining SEC-audited financials, delivered scale, and financing costs at the best tier available (DDTL 4.0 achieved an A3 / DBRS A(low) investment-grade rating). |
13 Strategic implications for modular data centre developers
This section draws operational conclusions for the business of modular container data centres serving global AI enterprises, derived from the public data above. It does not constitute investment advice.
13.1 The real bottleneck has moved from GPUs to energisation speed
| 6 months | FluidStack’s claimed energisation cycle Industry norm is 18-24 months. This single difference underpins FluidStack’s valuation doubling from USD 7.5bn to USD 18bn in six weeks |
| 12-14 months | Core Scientific’s compressed ready-for-service cycle Achieved by advance procurement of long-lead equipment plus reuse of already-energised mining infrastructure |
| 52-78 weeks | TSMC CoWoS lead time Long lead times at the silicon level mean whoever energises first monetises first — the speed premium is real |
Implication: the core value of modular and prefabricated construction is not being cheaper but compressing time-to-energisation. The evidence: Applied Digital uses precast concrete to run 1,200 tradespeople in parallel, and Firmus uses HyperCube modular liquid cooling to spread seven AI factories across Australia, Singapore, Indonesia and Malaysia while investing over A$300m in a local supply chain with 1.5GW of annual capacity. Turning procurement, logistics and on-site assembly speed into a productised offering attacks the most expensive variable in the industry.
13.2 Realistic unit-economics benchmarks (for quoting and project appraisal)
| Metric | Industry benchmark | Implication for a modular DC business |
| Build cost | USD 8-11m per critical IT MW | A modular approach that cannot reach the lower end of this range, or materially shorten the schedule, has no commercial case |
| Revenue per IT MW per year (3-year lease) | Above USD 20m (about USD 25m in negotiation) | This is the owner-operated GPU cloud basis; a pure powered-shell landlord basis is about USD 1.8-2.2m per IT MW per year |
| Project-level adjusted EBITDA margin (landlord) | Above 90% | Outsourcing the core asset to the customer (customer-supplied GPUs) delivers excellent margins but very high tenant concentration risk |
| Power cost advantage | Locked at 2.72-2.8 US cents/kWh against a market 10-12 cents | A 300MW site yields about USD 183m of annual cost advantage — power procurement capability is worth more than construction capability |
| Realistic PUE | About 1.1 (closed-loop liquid cooling) | Claims below 1.05 require verification of measurement convention (whether IT load and distribution losses are included) |
| Customer prepayment share | 45-70% of GPU capex (Nebius 50-60%, IREN 45-55%) | The most important financing lever in this sector: turning customer prepayment into your own construction funding |
13.3 The structural opportunity in Southeast Asia (directly relevant to the reader’s business)
- Demand growth is already documented. Synergy identifies Malaysia, Indonesia, Thailand and India as the fastest-growing cloud markets in local-currency terms, all well above the global average.
- Supply is being offshore-deployed rather than locally competed. Firmus has two Malaysian sites supplying OpenAI (signed 8 September 2026); Bitdeer is building in Cyberjaya (2MW) and Johor Bahru (21MW, 128 GB300 NVL72 racks, delivering Q1 2027); IREN’s projects in Nostrum (Spain) and Bundey (South Australia) indicate it is still evaluating Asia-Pacific. This means the region lacks localised rapid-delivery capability — precisely where modular solutions have a home advantage.
- Sovereignty and compliance, not price, is the primary procurement motive in Asia-Pacific. Core42’s core selling point is not price but being ‘the only Gulf cloud licensed to acquire advanced NVIDIA silicon at scale under export controls’; Yotta’s CEO claims 60-70% of India’s installed GPU capacity. For Asia-Pacific customers, the premium for ‘data does not leave the jurisdiction plus local energisation’ exceeds the premium for ‘cheaper than the US’.
- Risks to place alongside (mandatory). (i) Power conditions remain a hard constraint — Nscale paused Stargate UK because UK power prices are roughly four times US/Nordic levels, showing that in a region without cheap stable power, modular advantages cannot offset a power-price disadvantage. (ii) Customer concentration applies in Asia-Pacific too: if a single hyperscale tenant adjusts its Malaysian footprint, local capacity sits idle. (iii) The NVIDIA Kyber rack (about 600kW) transition in H2 2027 will require retrofits, so the reconfigurability of a modular design should be sold as a headline promise, not an incidental feature.
| One-sentence conclusion Value creation in this sector is shifting from who owns the GPUs to who can energise and deliver GB300/Vera Rubin-class racks at a certain time and a certain power price. GPUs are a commodity anyone can buy; power and energisation speed are not. If a modular container solution can turn ‘time to energise’ and ‘rack-generational compatibility’ into contractual product metrics rather than engineering characteristics, it addresses the scarcest supply capability in the 2026 Neocloud market. |
14 Sources, calibres and limitations
14.1 Primary sources (directly relied upon)
| Company | Source document | Date |
| CoreWeave | Q2 2026 results release (investors.coreweave.com); Q1 2026 Form 8-K Exhibit 99.1; FY2025 results | 11 Aug 2026; 7 May 2026 |
| Nebius | Q2 2026 financial results and shareholder letter (SEC Form 6-K); Meta agreement 6-K; secured financing 6-K | 12 Aug 2026; Mar 2026; 17 Jul 2026 |
| IREN | FY26 Form 10-K and 8-K; Q3 FY26 8-K; GPU financing announcements | 27 Aug 2026; 7 May 2026; 1 Jun 2026 |
| TeraWulf | Q2 2026 Form 8-K; Form 10-K (sec.gov 0001083301-26-000031); Anthropic lease announcement | 5 Aug 2026; 6 Jul 2026 |
| Core Scientific | Q2 2026 results release; Q1 2026 presentation | 28 Jul 2026 |
| Hut 8 | Q2 2026 results; River Bend / Beacon Point financing and lease announcements; revolver announcement | 20 Jul 2026; 28 Sep 2026 |
| Applied Digital | FY26 Form 10-K; Q3 and Q4 FY26 Form 8-K | 8 Apr 2026; FY26 |
| Galaxy Digital | Q2 2026 results; Helios-related announcements | 5 Aug 2026 |
| Cipher Digital | Q2 2026 results materials; Stingray project debt pricing announcement | 8 Jun 2026; Aug 2026 |
| Bitdeer | Q2 2026 release; SEC Form 6-K (Tydal / Volta lease) | 10 Aug 2026; 4 Aug 2026 |
| Nscale | Form S-1 registration statement (filed with the SEC) | 18 Sep 2026 |
| NVIDIA-related transactions | SEC Form 6-K (Nebius / Meta agreement; secured financing) | Mar 2026; Jul 2026 |
14.2 Pricing data
coreweave.com/pricing | nebius.com/prices | lambda.ai/pricing | crusoe.ai/cloud/pricing | together.ai/pricing | fireworks.ai/pricing | modal.com/pricing | runpod.io/pricing | vast.ai/pricing | baseten.co/pricing | hyperstack.cloud/gpu-pricing | scaleway official pricing | vultr.com/features/datacenter-regions
14.3 Known data gaps and limitations
| Four explicit limitations of this report (1) Calibres are not comparable. The revenue column mixes quarterly actuals, full-year guidance, quarter-annualised figures and ARR. ‘Contracted power’ is not uniformly defined across the 20 companies (it variously means signed PPAs, approved interconnection or capacity covered by signed leases). The rankings here are for order-of-magnitude intuition and structural judgement only, and must not be used for precise comparison or valuation work. (2) Private-company financials are missing. Lambda, Crusoe, FluidStack, Baseten, Modal, Together AI, Fireworks AI, RunPod, Vast.ai, SF Compute, Firmus, Core42 and Yotta do not disclose audited full financial statements. Their revenue figures come from company statements or media estimates, so multiple calculations carry uncertainty. These companies cannot be compared on the same calibre as CoreWeave or Nebius. (3) The depreciation-policy comparison is missing. This report could not obtain a complete side-by-side of GPU depreciation policies, so the conclusions in section 11 on depreciation are structural rather than quantitative. This is the single most important data gap in assessing the sector. (4) Several source conflicts remain. Identified and flagged: Firmus IPO valuation (USD 15.5bn vs USD 60bn), Scaleway revenue (EUR 100m vs EUR 500m), Nscale H100 pricing (USD 2.29 vs 3.49), CoreWeave contracted power (4.2GW vs 3.7GW), Bitdeer share count, and IREN’s historical power-price disclosure. Wherever something is marked ‘to verify’, confirm against official company disclosure before quoting it. |
| One widely repeated claim corrected ‘Northern Data sold its bitcoin mining business to Riot Platforms’ — no credible source supports this. The actual buyers were three entities linked to Tether executives, for consideration of up to USD 200m, completed on 3 November 2025. Northern Data itself was acquired by Rumble Inc. in an all-stock deal for about 85.2% on 17 June 2026, renamed RUM Group, folded into the Quake AI division and delisted from the Munich m:access segment on 31 July 2026. Riot Platforms’ 2.5GW power reserve belongs to a different company and must not be conflated. |
| Disclaimer This document is based on publicly available data and quantitative analysis and is provided for information only. It does not constitute investment advice. Markets carry risk and investment requires caution. Any investment decision should be made independently in light of your own risk tolerance, financial position and objectives, and with advice from a licensed professional where appropriate. Past performance does not indicate future returns. |
This report draws extensively on valuation and revenue data for unlisted companies, some of which comes from media reports, third-party estimates or voluntary company disclosure and has not been audited. The six-dimension scores in section 10.1 are a subjective judgement by this report based on public data and are not the conclusion of a third-party rating agency. Readers should independently verify the latest primary disclosure before acting on anything in this document.
The Global Neocloud Top 20: A 2026 Deep-Dive Comparative Study
20 core providers plus a 10-company watchlist | Data cut-off 29 September 2026 | Drawing on 12 categories of primary filing, 13 official pricing pages and 20+ secondary sources. Prepared by Plugin Capital Research.