
The Co-Happiness Report — testing whether technology can make people happier where they live, and turning the answer into an operating system for any living asset.
Prepared for living-sector operators, developers and investment committees · Confidential discussion draft, October 2026 · A successor to Alternative Living — More Than Just a Place to Live (2019)
Prepared by Kevin Lim · Managing Director, Plugin Capital Pte Ltd · klim@plugin-capital.com · +65 9488 3168
Contents
What this report argues
Executive summary
The conviction
AI will make life easier. That is its purpose. It is not its ceiling — and it is not happiness.
We hold this conviction with real force: the greatest value of AI in property is not what it does to residents — it is what it gives back to the people who serve them. Every hour AI returns is an hour a human can spend on something that actually makes people happy. Reports that once consumed days are now drafted in minutes; compliance summaries, leasing narratives, ESG disclosures, board packs, compressed from hours to moments. That reclaimed time must not flow back into more reporting. It should flow into team building, into real conversation with customers, into exploring the next project. AI does the work. People do the caring.
Because happiness is not computed. Happiness is felt — through the five senses, and through other people. A meal that tastes good. A room that looks right. Music that lifts the mood, a scent that calms, a massage that releases the day. No algorithm serves a warm welcome, shares a meal across a table, or makes someone feel known. These are sensory and human; they cannot be automated into existence.
The more the world is run by cold machines, the more valuable human warmth becomes. In a machine-dominated world, the person at reception, the neighbour at the shared kitchen table, the kind word at the right moment, become the rarest and most defensible luxury a living space can offer.— the central thesis of this report
So our answer to the title question is not a slogan. It is a division of labour:
| AI ≠ Happiness. AI buys back time. Humans spend it on happiness. This report tests that conviction against the evidence — the scale of the loneliness problem, what residents actually choose, what the market actually pays for, and what AI has actually proven — and turns it into an operating system any living asset can run. |
Chapter 1
The Question
Every operator now claims the same thing: “Our AI makes residents happier.” The pitch is everywhere — smart assistants, sentiment dashboards, companion bots. It is also, mostly, unproven.
Here is the uncomfortable counter-evidence. In 2025, MIT Media Lab and OpenAI ran a randomised controlled trial with 981 people over four weeks and more than 300,000 messages. The headline: heavy voluntary users of AI companions ended up more lonely, with higher emotional dependence and more problematic use. If AI equals happiness, why does using it more make people less happy?
| Myth vs reality. friction |
This report is structured as a trial, not a sales deck. We put the promise in the dock and call four witnesses: the loneliness data (is happiness even a real need?), the demand data (what do residents actually pick?), the capital data (will the market pay?), and the AI record (what has it actually delivered?). Then we render a verdict — and an operating system.
Chapter 2
Why Happiness, Why Now — the loneliness economy
In 2025 the World Health Organization stood up a global Commission on Social Connection and called loneliness a pressing health threat. The numbers are not soft. They are actuarial.
What do we even mean by “happiness”? A working definition
Before we debate whether AI can deliver happiness, we need a working definition. We borrow it from Sammy Lee of the Lee Kum Kee Group, whose Project Heha frames the highest happiness as Shuang: “a heartfelt, fundamental joy that is not shaken, whether circumstances are favourable or adverse.” That is the happiness this report means — felt through the five senses and through other people, never manufactured by a device, yet something a well-run building can clear the path to.
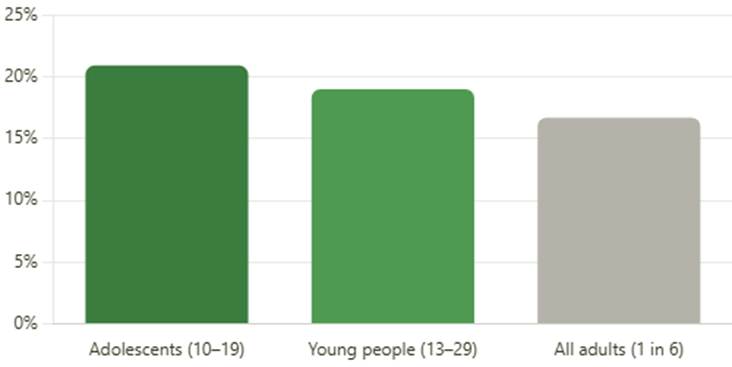
| 1 in 6 adults worldwide feel lonely — a health risk now ranked alongside smoking WHO Commission, 2025 | 871,000 deaths a year are linked to loneliness and social isolation — roughly 100 every hour WHO, 2025 | 17–21% of people aged 13–29 report feeling lonely, with adolescents at the very top WHO, 2025 |
Loneliness is not evenly spread — the young bear the most
Share reporting loneliness, by age band. Source: WHO Commission on Social Connection, 2025.
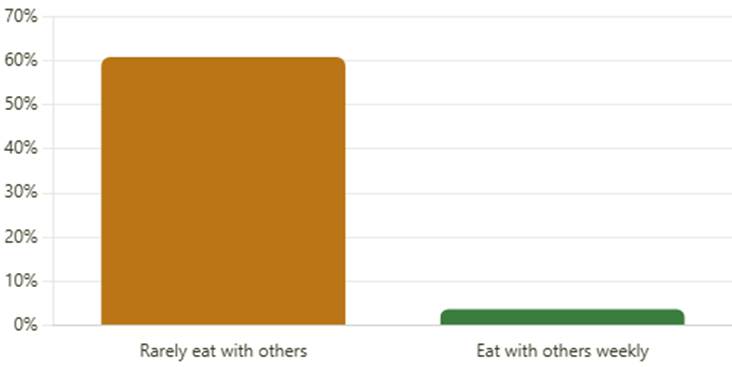
The Japanese data is the clearest warning for the living sector. Japan’s Cabinet Office found that 55.1% of people living alone feel lonely — but the single strongest correlate is not living alone. It is eating alone. Those who rarely dine with others are lonely at 60.8%, versus just 3.7% of those who eat with others weekly. That is a 16-fold gap, and it is a product brief for a shared kitchen.
The 16-fold gap: eating together is a happiness intervention
Loneliness prevalence by dining frequency, Japan, 2025. Source: Japan Cabinet Office Loneliness & Isolation Survey, 2025.
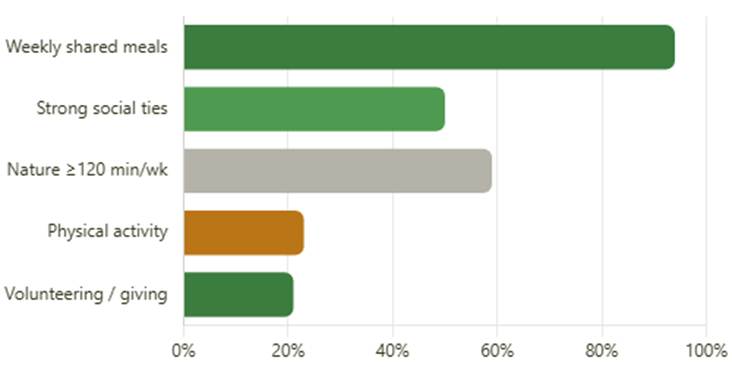
Eating together is the most vivid lever — but it is far from the only one the research supports. The same bodies of evidence that flag loneliness point to a short list of activities that reliably move wellbeing. None of them is a device. All of them are things a well-run building can make easy:
More than the table: what else the research ties to happiness
Each bar uses a different but consistent measure — relative loneliness reduction, survival odds, health odds, depression-risk reduction, or wellbeing-point gap — and is sourced individually below. The common thread: connection, movement, nature and generosity, not technology.
We are building the most sensor-rich, app-controlled, friction-free buildings in history — for the most isolated generation in recorded history. That is not a contradiction to resolve later. It is the product itself.— the strategic opening for the sector
| IMPLEMENTATION Build a “third-place” dining program, then measure it like a KPI Do not wait for residents to cook together. Program it. Run a hosted shared supper three nights a week in the communal kitchen; seed each table with one resident ambassador; track the two metrics that matter: Dining-frequency index — % of residents eating with others ≥2×/week (the Japan data says this is the variable that moves loneliness).Belonging score — a 5-question UCLA loneliness-lite survey at move-in, 6 weeks, and quarterly. Cost: roughly one part-time community host per 150–200 beds. Payback: retention, not savings — see Chapter 4. |
Chapter 3
What residents actually choose
Strip away the vendor hype and ask the people who pay rent. The evidence — from more than 48,000 students across 1,500 properties — is consistent: residents want affordability, a room that works, and a community they belong to. They do not rank “technology” anywhere near the top.
| 70% of institutions say apartment-style is the most-requested room type StarRez, 2025 | 51% of applicants want a private room within a shared setting StarRez, 2025 | 1 in 3 students struggle to make new friends where they live Global Student Living Index | 41% of students feel lonely — and their wellbeing score collapses by 13.8 points Student Living Monitor |
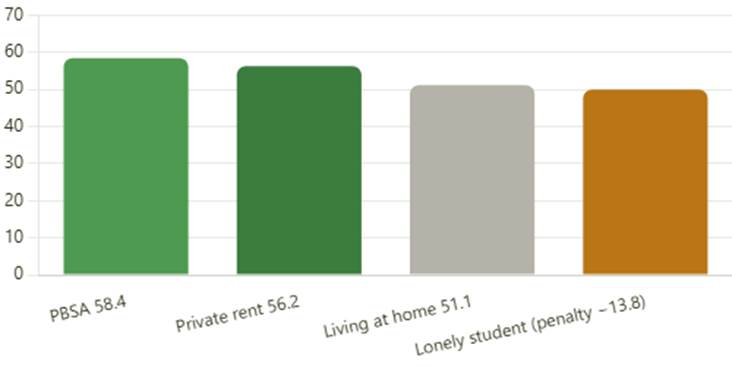
The student-wellbeing data is the most damning chart in this report. Students in purpose-built accommodation (PBSA) score higher on mental wellbeing (MHI-5 = 58.4) than those in private rental (56.2) or living at home (51.1) — but the moment a student is lonely, their score falls from 63.7 to 49.9. Loneliness is the single largest swing factor in student wellbeing — larger than rent, larger than room size.
Belonging is the largest single swing in student wellbeing
Mental wellbeing (MHI-5, higher = better). The loneliness penalty (−13.8) dwarfs the gap between housing types. Sources: Student Living Monitor 2023–25; The Class Foundation.
| Myth vs reality. more than 60% actively want tech-free spaces |
| IMPLEMENTATION The 6-week belonging onboarding (a repeatable playbook) Research is unambiguous that the first six weeks set the tone. Operationalise it: Week 1: human welcome, not an app login — a 10-minute in-person check-in; roommate “user manual” swap (sleep, noise, guests).Week 2–3: small-group invites (≤8) to a hosted meal or activity; one ambassador per floor.Week 4: first belonging survey; flag anyone scoring low for a personal follow-up.Week 6: re-survey; target a measurable lift in the dining-frequency index and belonging score before the first rent cycle. This is staff-time intensive by design. Chapter 5 shows how AI buys that time back. |
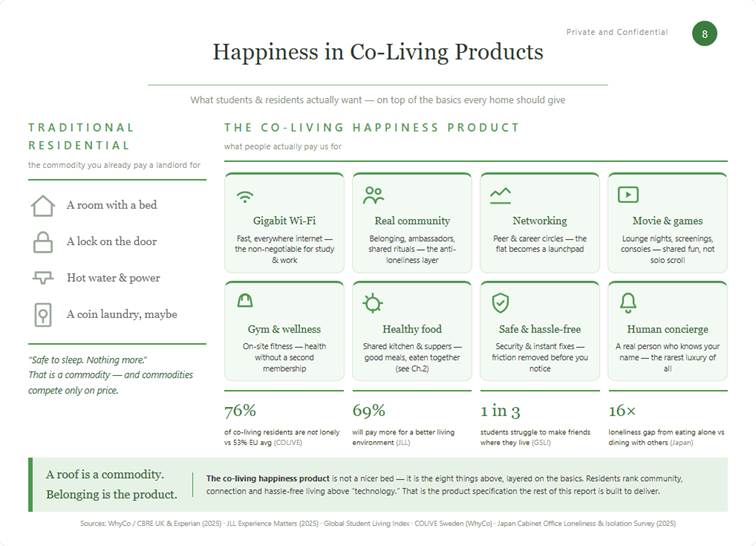
Infographic 1 — Happiness in Co-Living Products: what students and residents actually want
Chapter 4
Does the market pay for happiness?
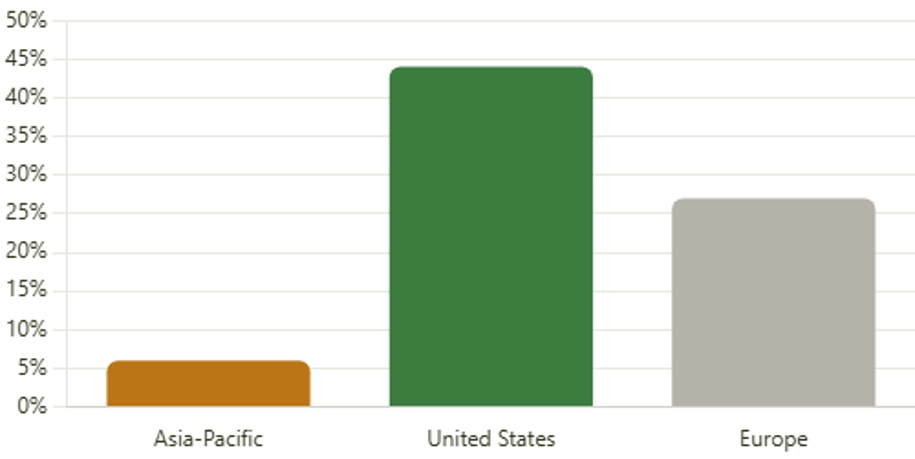
The living sector in Asia-Pacific is structurally under-built. Since 2019 it has absorbed just 6% of regional commercial-real-estate investment, against 44% in the US and 27% in Europe. That gap is the opportunity — and the proof that “happiness as an asset class” is still mispriced.
The living sector is dramatically under-allocated in Asia-Pacific
Share of commercial real-estate investment, living sector, 2019–2024. Source: CBRE Asia Pacific Living Sector, 2025.
And where it exists, it performs. Singapore co-living runs 85–95% occupancy (breakeven is 70–75%) with 55–70% GOP, and has drawn over S$1.4bn since 2022. The demand signal is even sharper in the UK: demand outstrips supply more than 30 to 1 — 3.7 million potential tenants for just 11,400 co-living beds.
The physical layer of happiness is already priced. Daylight commands a 5–6% rent premium; a green view 5.6–7.8%; health-certified buildings 4.4–7.7% more rent, with leases 13 months longer and satisfaction up 28–30%. The community layer — belonging, connection — is not yet priced on any balance sheet. That gap is your alpha.— the investment thesis
| 4.4–7.7% rent premium for health-certified (“happy”) buildings WELL / MIT | +13 mo longer average lease tenure in healthy buildings WELL / IWBI | +28–30% higher occupant satisfaction WELL / IWBI | 30 : 1 co-living demand-to-supply gap (UK) WhyCo / CBRE UK |
| IMPLEMENTATION How to underwrite the community premium (investment committee version) Add three lines to the model: retention uplift, premium achievable on community-rated assets, and opex saved from AI-driven friction removal.Require a belonging score in every asset’s monthly pack — treat it like NOI, not a nice-to-have.Underwrite the “happy” premium conservatively at the low end of WELL evidence (≈4–5% rent, +6 months tenure) until your own first-party data confirms more. The 2019 report’s Hong Kong case showed a retrofit lifting NOI by 33%. The Co-Happiness version makes the driver explicit: belonging → retention → NOI. |
Chapter 5
The AI scorecard — promise vs proof
We sort AI into four roles and score each against evidence. The pattern is consistent: AI excels at removing unhappiness (friction, cost, risk). It is unproven — and sometimes counter-productive — at manufacturing happiness (connection, meaning).
The four AI roles
1. Invisible Ops AI — maintenance, billing, energy. Removes friction.
2. Matching AI — roommate & activity matching. Catalyses connection.
3. Caring AI — companions & check-ins. Compensates, does not replace.
4. Owner AI — retention & pricing. Turns happiness into NOI.
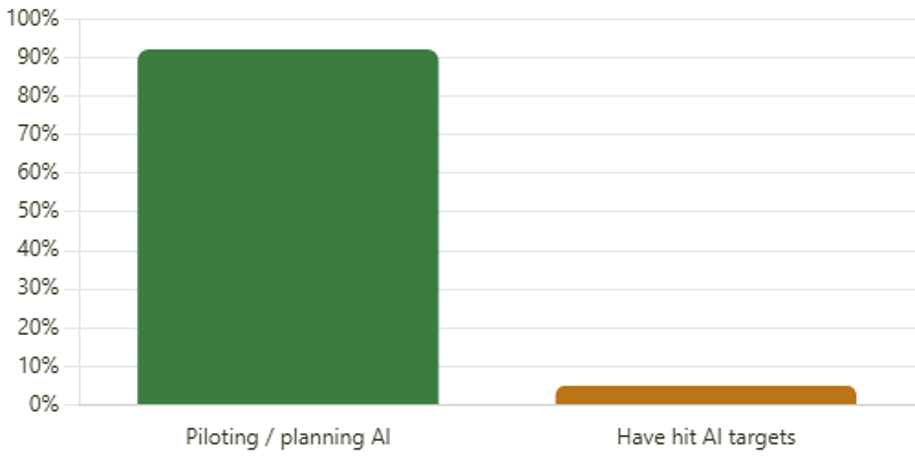
The AI gap: everyone is piloting, almost nobody is realising
92% of real-estate firms pilot or plan AI (up from 5% three years ago) — yet only 5% have hit their targets. Source: JLL Global Real Estate Technology Survey, 2025.
| 9% median energy savings from AI fault detection; ~2-year payback US DOE / LBNL, 6,500 buildings | >80% of large tenants already run predictive maintenance JLL, 2025 | 15 min with a well-designed AI companion lowers loneliness ≈ a human chat Harvard Business School | n=981 RCT: heavy AI-companion users ended up more lonely MIT × OpenAI, 2025 |
| IMPLEMENTATION AI triage SOP — fix it before they complain Intake: resident reports an issue via app or voice; AI classifies, prioritises and routes in seconds (no human in the loop for triage).Dispatch: work order auto-sent to the right vendor; ETA predicted.Pre-empt: sensor data flags a failing unit (HVAC, leak) and the ticket opens before the resident notices.Close the loop human: a community host personally follows up on anything tagged “comfort” or “relationship”, not just “repair”. Rule: every AI touchpoint that touches a person’s wellbeing has a named human backstop. No exceptions. |
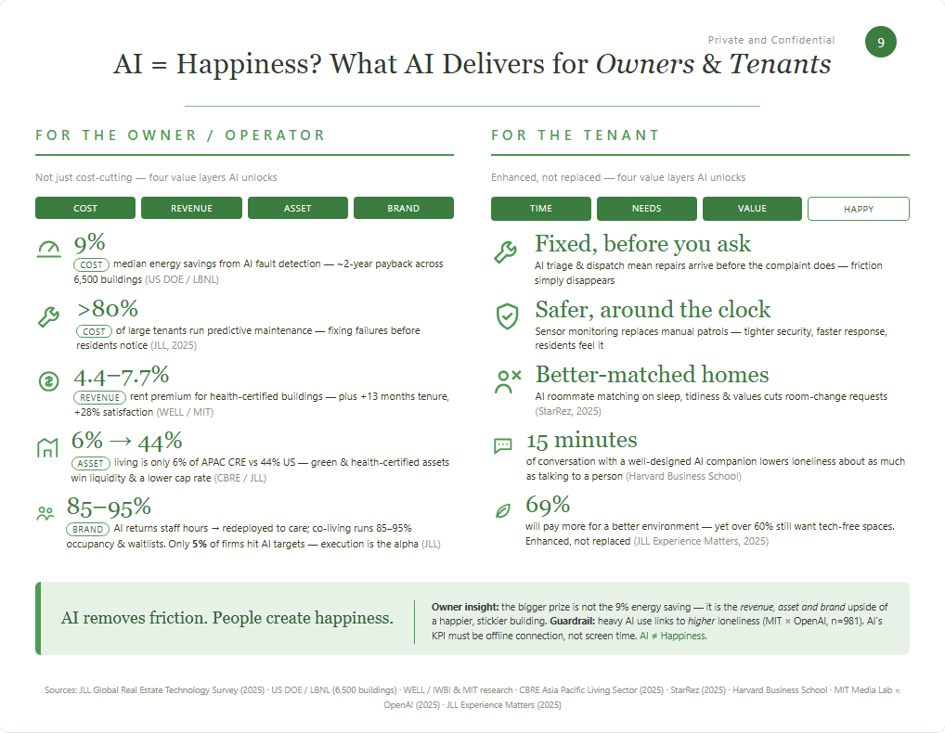
Infographic 2 — AI = Happiness? What AI delivers for owners and tenants
Chapter 6
Field notes — three real places AI meets happiness
Three concrete settings. Each follows the same logic: AI frees time; people do the caring. None of them touches the “AI and the human soul” debate — they are operational.
Field note 1 — The time dividend (staff & roles)
How many hours a week does a building team spend writing reports — weekly ops, compliance, leasing narratives, ESG disclosures, board packs? AI drafts, summarises and formats them in minutes. The liberated hours are not a licence to cut headcount; they are redeployed into the work that actually retains tenants. Take a property manager who used to spend two afternoons a month assembling the owner report and the leasing deck. AI now produces the first draft in twenty minutes. Those eight hours go instead to walking the floor, knowing residents by name, and catching a churn risk at the move-out interview rather than at the vacancy. That relationship work is what lifts the renewal rate, the referral flow and the achievable premium — the three things the asset’s value actually rides on. The KPI is not “reports per FTE.” It is “human hours returned” — and what they were spent on.
Field note 2 — The interchangeability of space: why they choose to work from home
Tenants and employees increasingly work from home — and the reason is rarely the laptop. It is that the office is not a happy place to be: commute, crowding, cold light, no good food, no one to talk to. AI makes working from anywhere effortless — a good connection, a booking app, a hot desk wherever they land. So the choice is no longer “office or home.” It is “the happier place.” If the office feels flat, they stay home; if it feels like somewhere they want to be, they come in. Space has become interchangeable, and happiness is the tie-breaker. That is why the leverage sits with the landlord who turns the building into the happier option, not the one who installs another sensor. AI can tell you the desks are empty; it cannot make the room worth returning to. Designing and running that “worth returning to” is a human job.
Field note 3 — The smarter home: AI as hygiene, not motivation
AI-powered smart homes and buildings will, within a few years, be a given — a hygiene factor, not a motivator. A well-functioning building is more energy-efficient, responds faster, is safer to live in and quietly promotes better health. But residents never see the AI. They feel the result: the building just works, nothing goes wrong, and someone arrives before they had to ask. Safety and ease are preconditions for happiness; you cannot feel happy in a place that feels risky or broken. Once the smart layer is table stakes, it stops differentiating the product — and the differentiator becomes the human warmth on top. AI’s job here is to disappear, so the human experience can breathe.
| AI can tell you the seats are empty. It cannot make the room worth coming back to. These three notes are the operating manual for the rest of the report. Every chapter below converts one of them into a line item. |
Chapter 7
The Co-Happiness Stack
Our framework makes “happiness” an operable, measurable object. Four layers, each with its own metric:
Figure 1 — The Co-Happiness Stack: a four-layer operating model for any living asset.
The Co-Happiness Equation (the four conditions for AI to produce happiness)
- Friction first. AI earns its place by removing irritation before it attempts connection.
- Anti-engagement KPI. AI’s metric is the number of offline connections it enables — never screen time.
- Human backstop. Every AI touchpoint that touches wellbeing has a named person behind it.
- Measure it or it didn’t happen. Happiness is tracked, disclosed and managed like NOI.
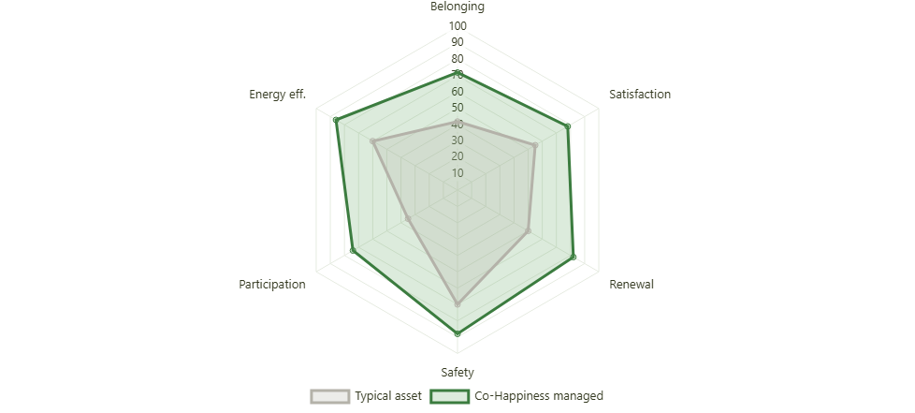
The Co-Happiness dashboard — a typical asset vs a managed one
Illustrative baseline (not measured). Scores are modelled placeholders for a standard asset versus one run on the Co-Happiness Stack; they are not operating results. Replace with first-party deployment data before citing.
Chapter 8
Beyond co-living — the happiness operating system
Co-Happiness is not a rebrand of co-living. It is a control system that drops onto any living asset. The loneliness risk — and the happiness lever — differs by asset class:
| Asset class | Loneliness profile | Happiness lever | AI application |
| PBSA / student | 41% lonely; first 6 weeks set the tone | Onboarding week, academic & interest communities, mental-health signposting | Roommate & room-type matching; stress signal monitoring |
| BTR / multifamily | Mixed families & professionals; weak neighbour ties | Pet / parenting / hobby communities; neighbour reciprocity | amenity booking; energy optimisation |
| Serviced apartments | Expatriates & travellers; low belonging | Arrival concierge; same-city peer circles | AI concierge; multilingual service |
| Senior / active ageing | WHO: 1 in 3 elders socially isolated; Japan 22,222 solitary deaths | Intergenerational co-living; shared meals; care continuity | Fall detection; health alerts; companion robotics (policy tailwind) |
| Key-worker housing | Shift workers; fractured community | Shift-aware communities; key-worker pricing | Roster-to-housing matching |
| Office / flex | Remote shift; empty desks; “the office is not a happy place” (Ch.6) | Weather-triggered hospitality; community lounges; hosted lunches | Leasing AI: churn prediction, sentiment, space-demand |
This is the expansion you asked for: the same stack, the same four conditions, rolled across the entire living portfolio — not just student dorms and co-living.
Office sector — exporting Co-Happiness to where people spend their daytime
The biggest happiness failure in real estate is not residential at all. It is the office. Tenants and employees increasingly choose to work from home — and the honest reason, as Field note 2 showed, is that the office is not a happy place to be. Commute, crowding, cold light, no good food, no one to talk to. AI cannot fix that. But the Co-Happiness Stack can — and AI can make the leasing of it smarter.
| Myth vs reality. timed |
How AI helps office leasing (not just the building)
AI’s job in office is to make the landlord a better host and a better underwriter — never the substitute for one:
- Churn prediction — models renewal intent from footfall, service tickets and community participation, so the leasing team intervenes before a tenant leaves.
- Tenant sentiment — natural-language analysis of tickets and surveys surfaces friction (temperature, noise, lift waits) the monthly NPS would miss.
- Space-demand forecasting — predicts which suites, layouts and floors will lease, cutting void periods.
- Community matchmaking — suggests cross-tenant introductions and events that raise the belonging score of the whole floor.
| IMPLEMENTATION The “weather-triggered hospitality” playbook — happiness as a reflex, not a campaign Program the building to care on autopilot, then let humans deliver it. Six moves — five sensory, human gestures triggered by data, plus one AI measurement layer: Cold snap → free hot coffee & tea in the lobby from 7am (an IoT thermostat or weather-API trigger switches on the barista stand).Rain forecast → human rescue, not just branded umbrellas. The umbrellas stay at concierge, free for the day — but the real gesture is a concierge or staff member stepping out into the rain to fetch people in: walk them from the drop-off to the lobby under an umbrella so no one arrives soaked. The device is the prop; the human is the point.“Apple Day” — a designated free-fruit day: free apples plus a daily health-supplement sample at the lift lobby.Friday → free dessert cart rolled through the floors at 3pm, filling the space with laughter and happiness.AI layer: the resident app pushes the day’s gesture; leasing AI tracks which gestures lift community-NPS and renewal intent, so the spend is optimised, not guessed.AI camera to read visitor happiness. A discreet, privacy-bounded camera at the lobby reads arrival expressions so the team sees, in real time, whether the day’s gesture is landing. AI measures; the host decides. It turns hospitality from guesswork into a managed KPI. Cost: a few hundred dollars a week per building. Payback: renewal intent, word-of-mouth leasing, and a building people actually want to come to — the exact problem Field note 2 named. This is the office version of the 6-week onboarding: small, sensory, human, measured. |
Chapter 9
Measurement & governance
If happiness is to be managed, it must be measured. We propose a three-tier instrument:
| MHI-5 + UCLA Loneliness Scale — clinical-grade wellbeing academic | NPS + renewal rate + activity participation — operational operator | kWh/bed energy per bed — the ESG and friction proxy asset | CHI Co-Happiness Index — our proposed disclosure standard new |
Governance — three pillars
- Fairness: matching algorithms audited for discrimination (no proxy bias on price, ethnicity, gender).
- Minimisation: behavioural data collected only to the level needed; GDPR and local privacy law by default; opt-out of any “caring AI”.
- Anti-addiction: no engagement-maximising design; dashboards report offline connection, never time-on-screen.
Chapter 10
Case files
| COLIVE Sweden: 76% of residents are not lonely vs 53% EU average — the benchmark proof point WhyCo / CBRE | THE FIZZ Europe: >90% report a positive sense of wellbeing under community programming operator | lyf / Habyt Asia-Pacific operators scaling community-led co-living with asset-light fees (10–13%) JLL | COOLOC France: AI roommate matching across 90,000 members — directional, vendor-reported (not independently verified) operator |
Policy tailwind: Singapore has converted government estates into co-living (Commune@Henderson); Japan’s 2024 Loneliness and Isolation Countermeasures Act opens public-private pathways that the Co-Happiness model is built to capture.
Chapter 11
The verdict — roadmap & due diligence
| AI ≠ Happiness. AI buys back time. Humans spend it on happiness. The evidence supports a conditional verdict: AI is a powerful remover of unhappiness and a catalyst for connection — never a substitute for it. Operators that treat the freed time as a licence to cut headcount will make tenants lonelier. Operators that redeploy it into human care will compound an unpriced premium. |
12-month rollout roadmap
Figure 2 — Sequence matters: measure, remove friction, build community, then disclose. Do not skip to AI companions.
Investor due-diligence — 10 questions
- What is the asset’s belonging / loneliness score, and is it trending?
- What is the dining-frequency index (the Japan-proven lever)?
- What human hours has AI returned, and where were they redeployed?
- Where is the named human backstop on every AI touchpoint?
- Is the community premium underwritten, or ignored?
- Are matching algorithms audited for bias?
- Is behavioural data minimised and opt-out honoured?
- Does any AI maximise engagement? (red flag)
- Is the Co-Happiness Index in the monthly operating pack?
- Has the 6-week onboarding been industrialised?
Three risk questions to price in
- Privacy & compliance: is the caring-AI layer resourced for GDPR-grade data minimisation, opt-out and audits — or is the compliance burden assumed away?
- Human-care labour cost: is the people budget protected — or will AI-freed hours be treated as a licence to cut heads? (red flag)
- Evidence limits: are vendor-reported and illustrative figures clearly flagged, and excluded from underwriting as if they were operating fact?
In 2019 this work asked: “More than just a place to live?” In 2026 the answer is sharper — the place that makes you happier, with a little help from AI, and a lot of help from the person at the door.— close
Prepared by
About the author
Kevin Lim is Managing Director of Plugin Capital, a boutique investment management firm focused on alternative real-asset investments. As a veteran real estate private equity professional who has invested in AI-powered data centres, Mr. Lim is a strong believer that it is people — not the machine — who truly create happiness at work. Mr. Lim served as fund manager for many institutional investors, including CalPERS, EPF, KWAP, Grundbesitz Global and BVK, and held various investment roles during his career at ARA, SC Capital and Deutsche Bank RREEF. The Co-Happiness Report extends his 2019 work, Alternative Living — More Than Just a Place to Live.
| Kevin Lim · Managing Director, Plugin Capital Pte Ltd klim@plugin-capital.com · +65 9488 3168 · Confidential discussion draft, October 2026 |
References
Sources
- World Health Organization — Commission on Social Connection, 2025 (1 in 6 lonely; 871,000 deaths/yr; youth 17–21%).
- World Happiness Report 2025 (dining together ↔ happiness; US eating alone +53% in 20 yrs; 19% youth no one to rely on).
- Japan Cabinet Office — Loneliness & Isolation Survey, 2025 (37.7% overall; single-person 55.1%; rarely-dining 60.8%; weekly-dining 3.7%).
- National Police Agency of Japan — solitary-death (kodokushi) statistics (~22,222 in a recent year).
- StarRez — State of Student Housing Industry, 2025 (418 institutions; room-type, satisfaction drivers, pain points).
- Global Student Living Index (48,000+ students / 1,500+ properties; friendship, belonging).
- The Class Foundation — Student Living Monitor 2023–25 (MHI-5 by housing type; loneliness −13.8).
- CBRE — Asia Pacific Live-Work-Shop & Living Sector: Case for Investment, 2024–25 (6% vs 44% vs 27%; Tokyo +55bps).
- JLL — Experience Matters, 2025 (12,000 respondents; safety & convenience; 69% premium; >60% tech-free).
- JLL — Co-Living in Singapore, 2025 (occupancy 85–95%; GOP 55–70%; S$1.4bn; asset-light fees).
- JLL — Korea co-living, 2025 (Seoul 23sqm; 1.5× officetel rent).
- WhyCo / CBRE UK & Experian — Building Homes … through Co-Living, 2025 (30:1 demand; 11,400 beds; COLIVE 76% vs 53%).
- WELL / IWBI & MIT research — healthy-building premiums (4.4–7.7% rent; +13 mo tenure; +28–30% satisfaction; daylight 5–6%; green view 5.6–7.8%).
- JLL — Global Real Estate Technology Survey, 2025 (92% pilot AI; 5% realise; >80% predictive maintenance).
- US DOE / LBNL — fault-detection & energy savings across 6,500 buildings (9% median; ~2-yr payback).
- Harvard Business School (De Freitas et al.) — AI conversation reduces loneliness ≈ human; mechanism “feeling heard”.
- Memphis study, 2025 (N=746 RCT) — anthropomorphic voice AI lowers loneliness via perceived empathy.
- MIT Media Lab × OpenAI, 2025 — 4-week RCT, n=981, 300k+ messages (heavy users lonelier; dependence; problematic use).
- Sammy Lee (Lee Kum Kee Group / Executive Chairman; founder, Project Heha) — The Shuang Project: Co-creating a Happier World (《爽工程:共创更快乐的世界》): happiness defined as Shuang, an inner, condition-independent joy; the “5+1+Others” framework.
- Sammy Lee — We Are Greater Than I: The Path To A Happier Life (Co-creating Happiness Limited, 2021): the “We > I” mindset as the commercial and relational basis of happiness.
- Holt-Lunstad, Smith & Layton — Social Relationships and Mortality Risk: A Meta-analytic Review, PLoS Medicine, 2010 (148 studies, 308,849 participants; strong social relationships → 50% greater likelihood of survival; loneliness → 26% increased mortality).
- White et al. — Spending at least 120 minutes a week in nature is associated with good health and wellbeing, Scientific Reports, 2019 (n=19,806; ≥120 min/week in nature → significantly higher health & wellbeing odds).
- Anglia Ruskin University — umbrella review, Neuroscience & Biobehavioural Reviews, 2024 (physical activity reduces depression risk by 23%, anxiety by 26%).
- Jiménez-López et al. — daily steps and depression, JAMA Network Open, 2024 (n=96,000; ≥7,000 steps/day → 31% lower depression odds).
- National Volunteer & Philanthropy Centre (Singapore) / SMU — Individual Giving Survey, 2013 (66% of givers vs 45% of non-givers report high wellbeing).
The Co-Happiness Report — discussion draft, October 2026. All figures attributed to the named sources. Radar-chart baselines in Chapter 7 are illustrative pending first-party deployment data. Successor to Alternative Living — More Than Just a Place to Live (2019). Confidential.